$86M+ In Ads-Attributed Client Revenue & $2.5M/Month In Active Ad Spend Across Our Client Portfolio.
Home services. Law firms. Med spas. Dental. Solar. Coaches. Clinics. The same demand-generation system, proven across 39+ high-ticket niches. No theory, no cherry-picked case study — just the unfiltered receipts: real dashboards, real revenue, real booked appointments.
Free 30-minute call. No pitch. No fluff. No high-pressure close.
See It In Their Own Words.Wes: $320K/mo → $1.2M/mo in 4 months with us
The Numbers Don't Lie.$70,000 in additional revenue, directly from ads, in the first week of working together
The Proof Behind $86M+ In Ads-Attributed Client Revenue.
Real screenshots. Real clients. Real revenue. A selection of what service businesses across 39+ niches are doing with our demand-generation system — tagged by the niche each result maps to.
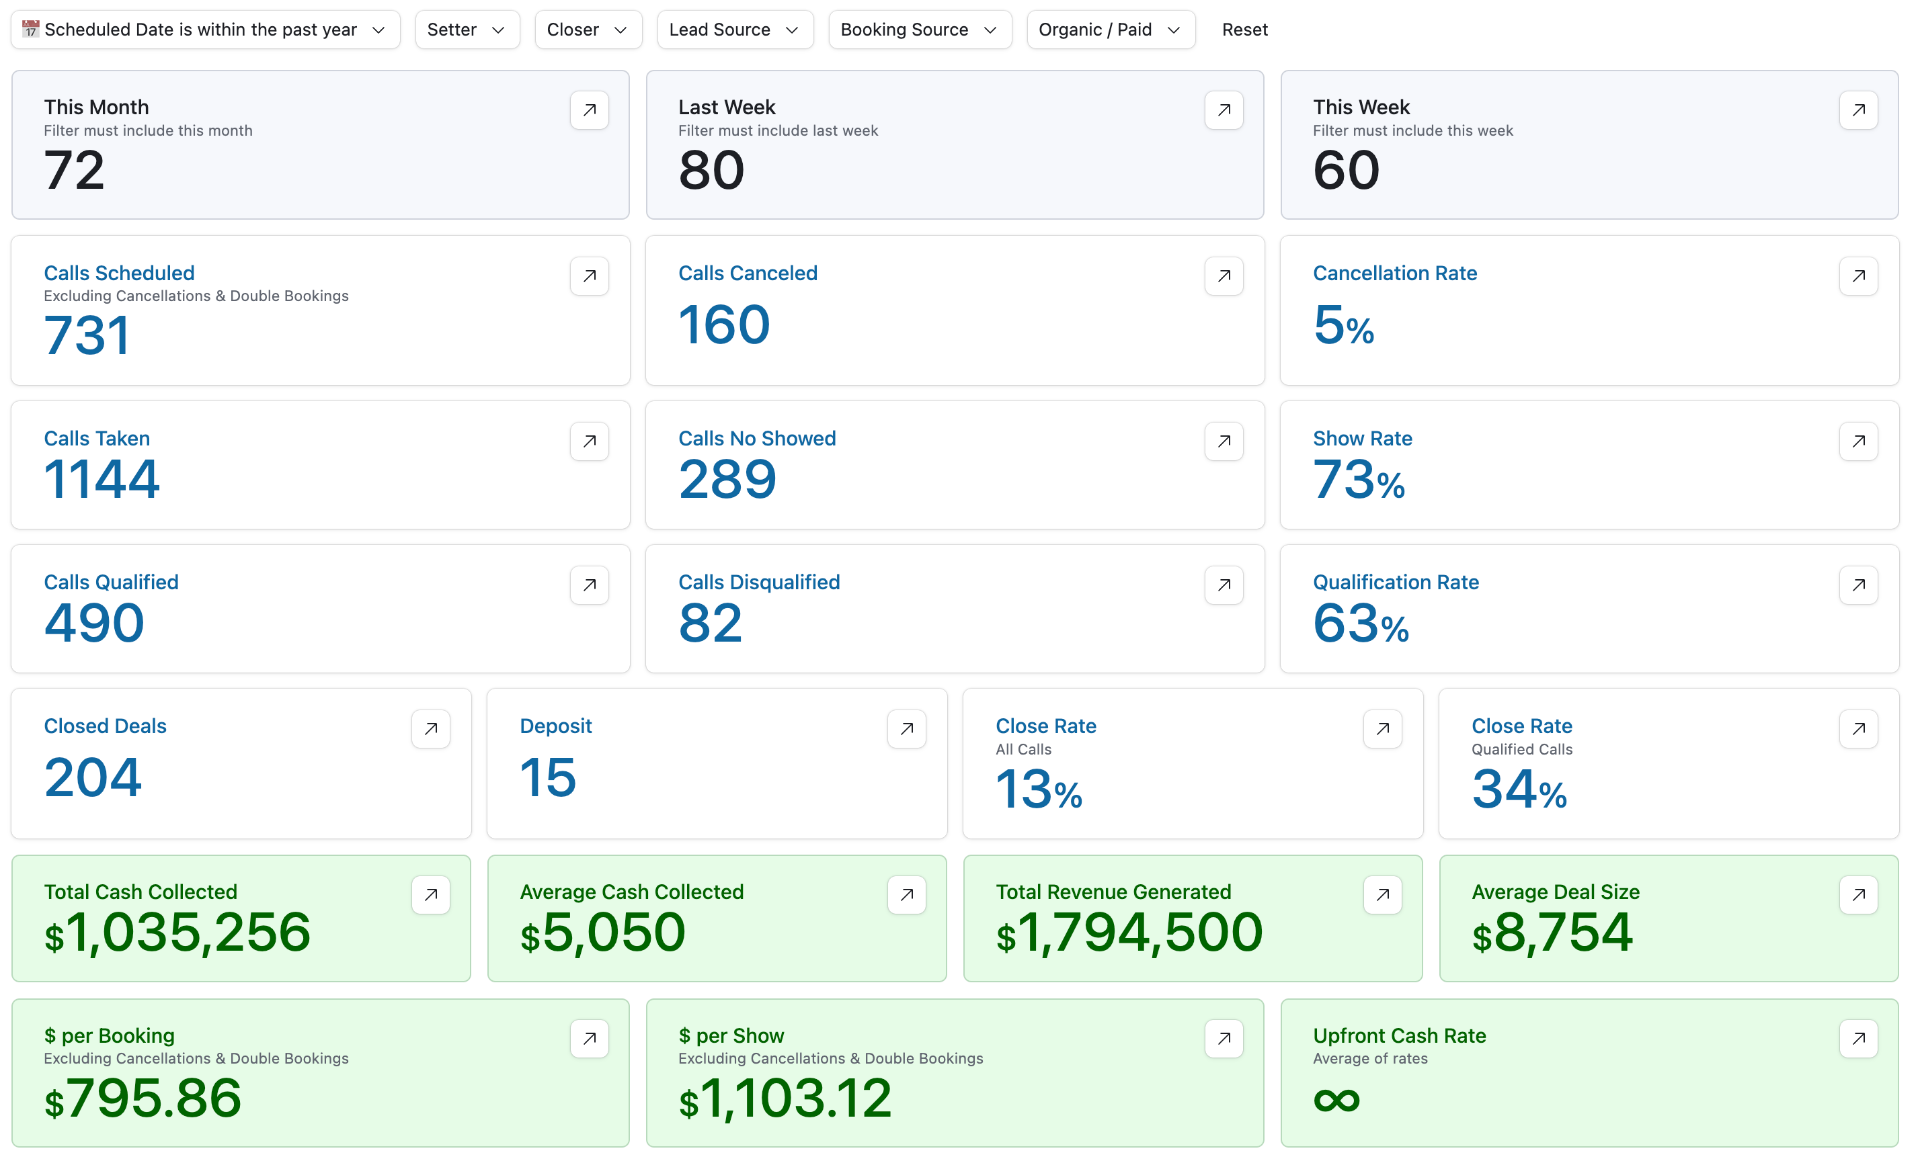
CRM — Past Year: 731 Calls, 204 Deals, $1.79M Revenue
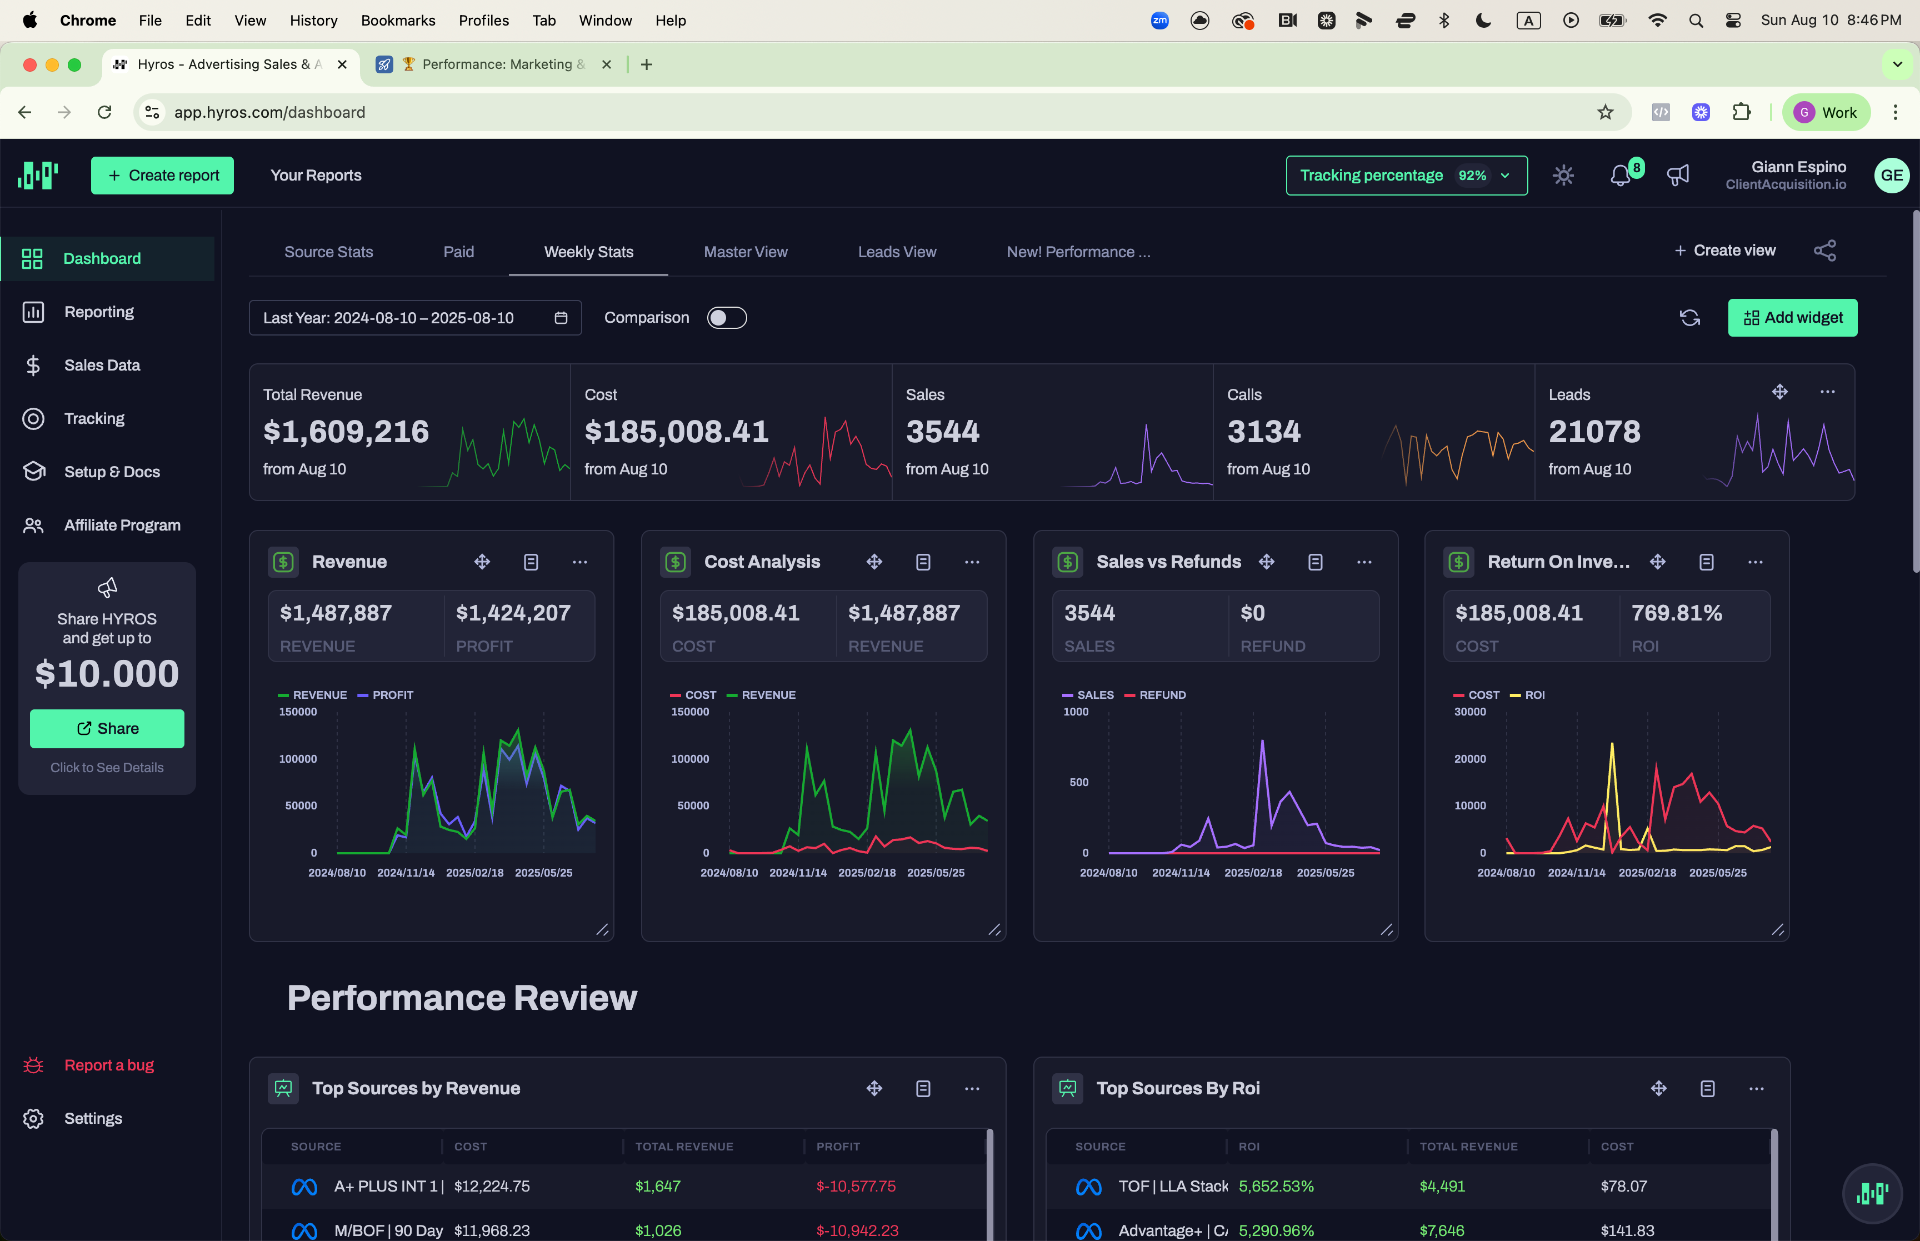
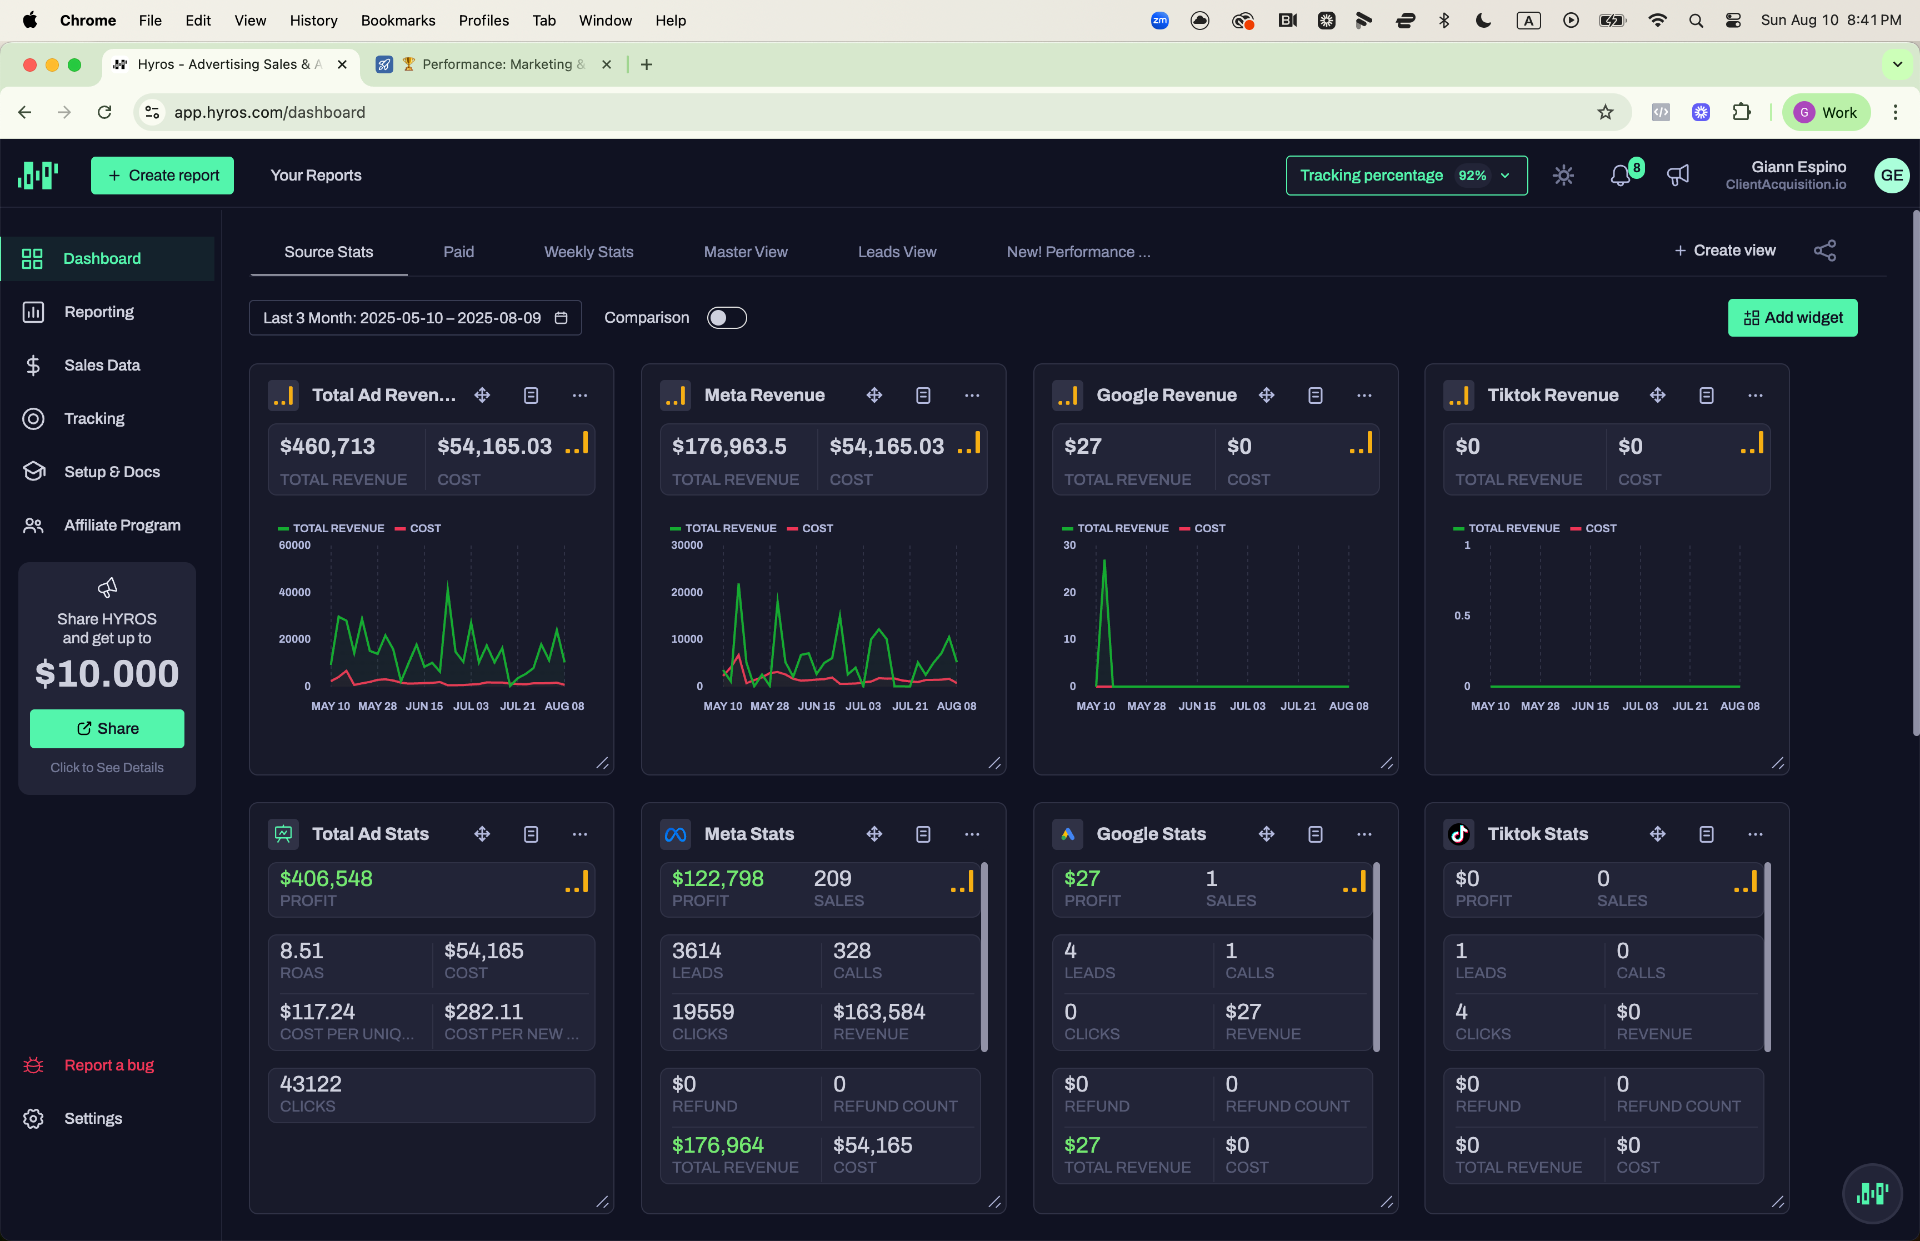
Hyros — 12-Month Weekly Stats: $1.6M Revenue, 3,544 Sales
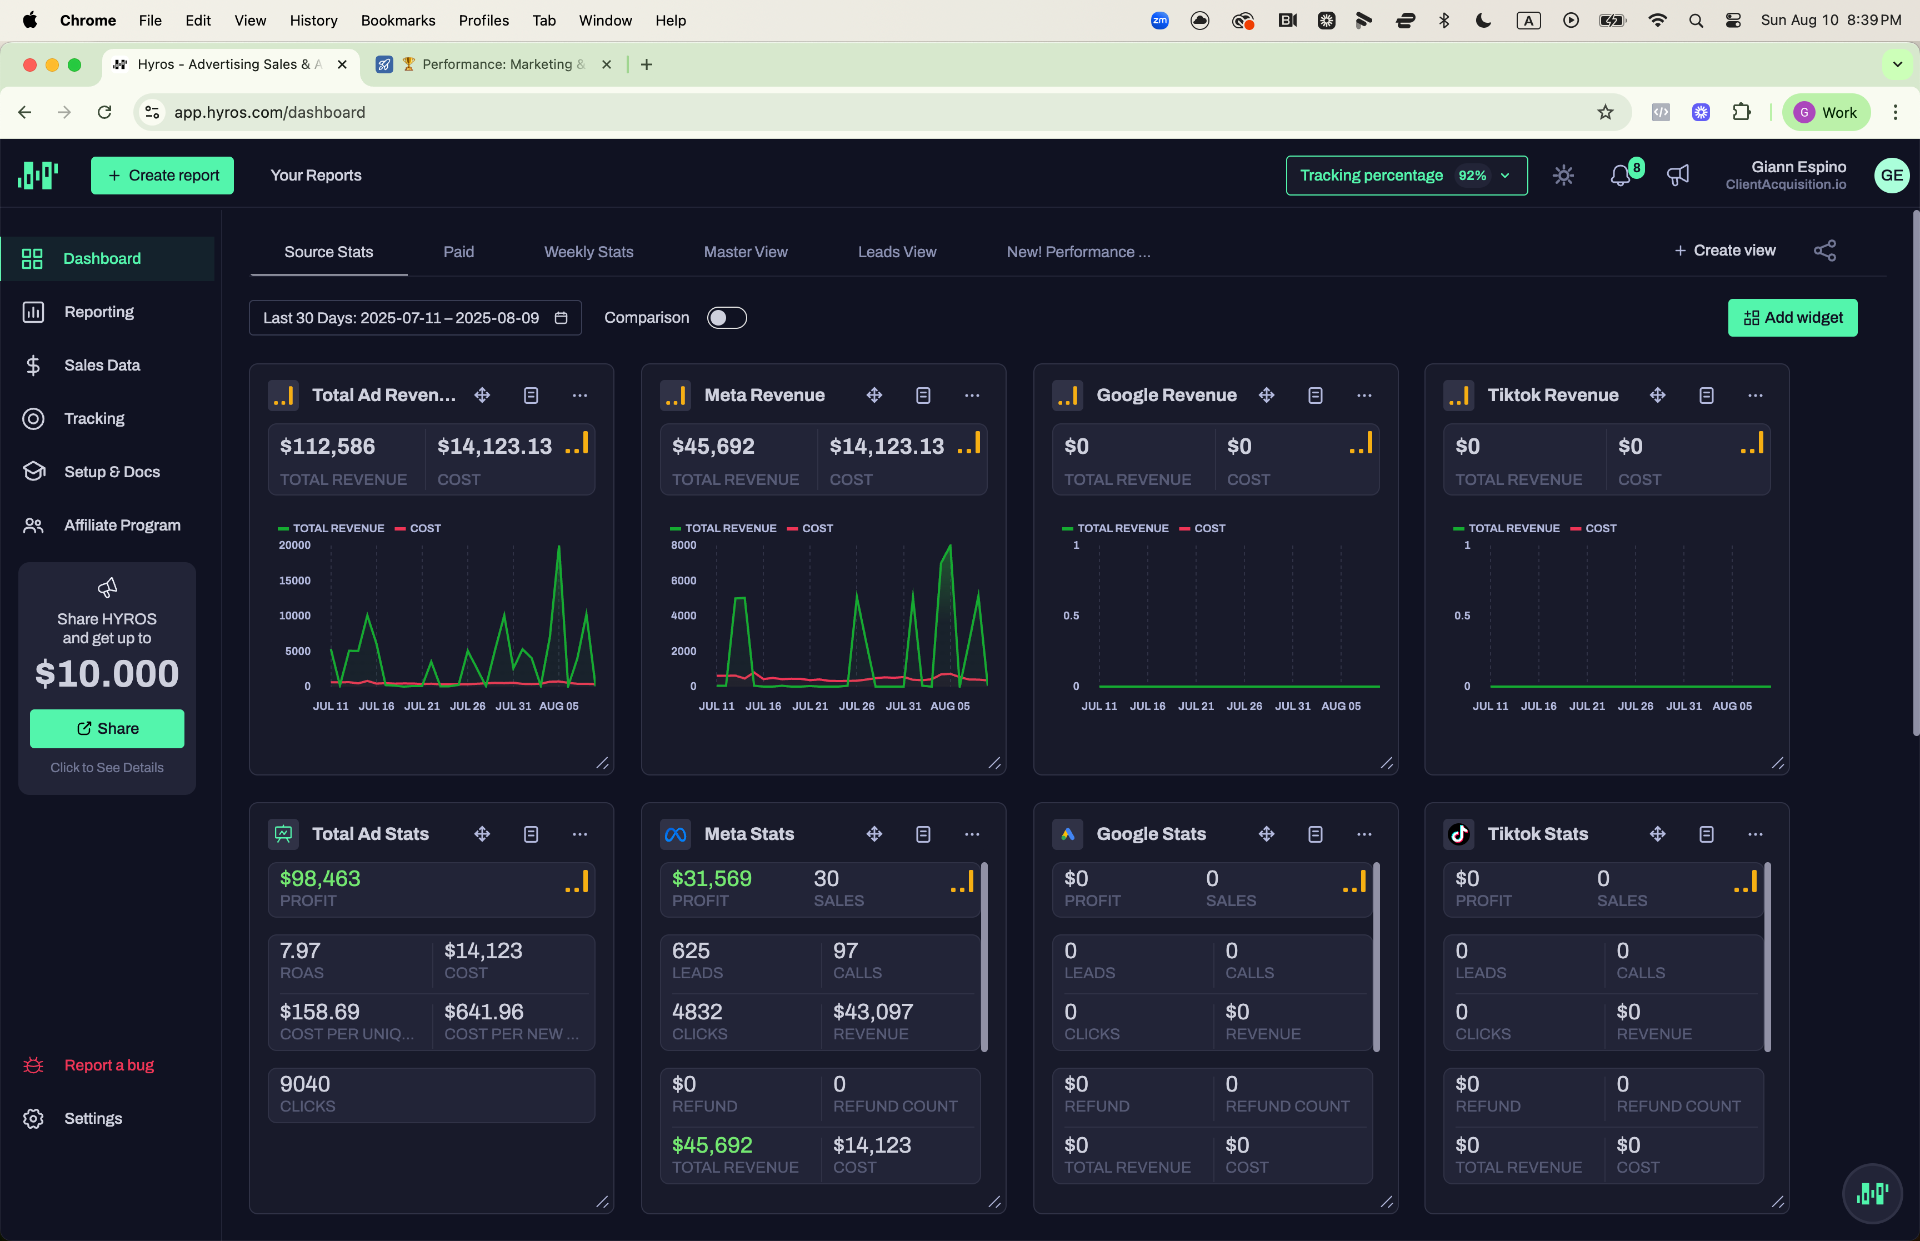
Hyros — 30-Day Source Stats: $112K Revenue
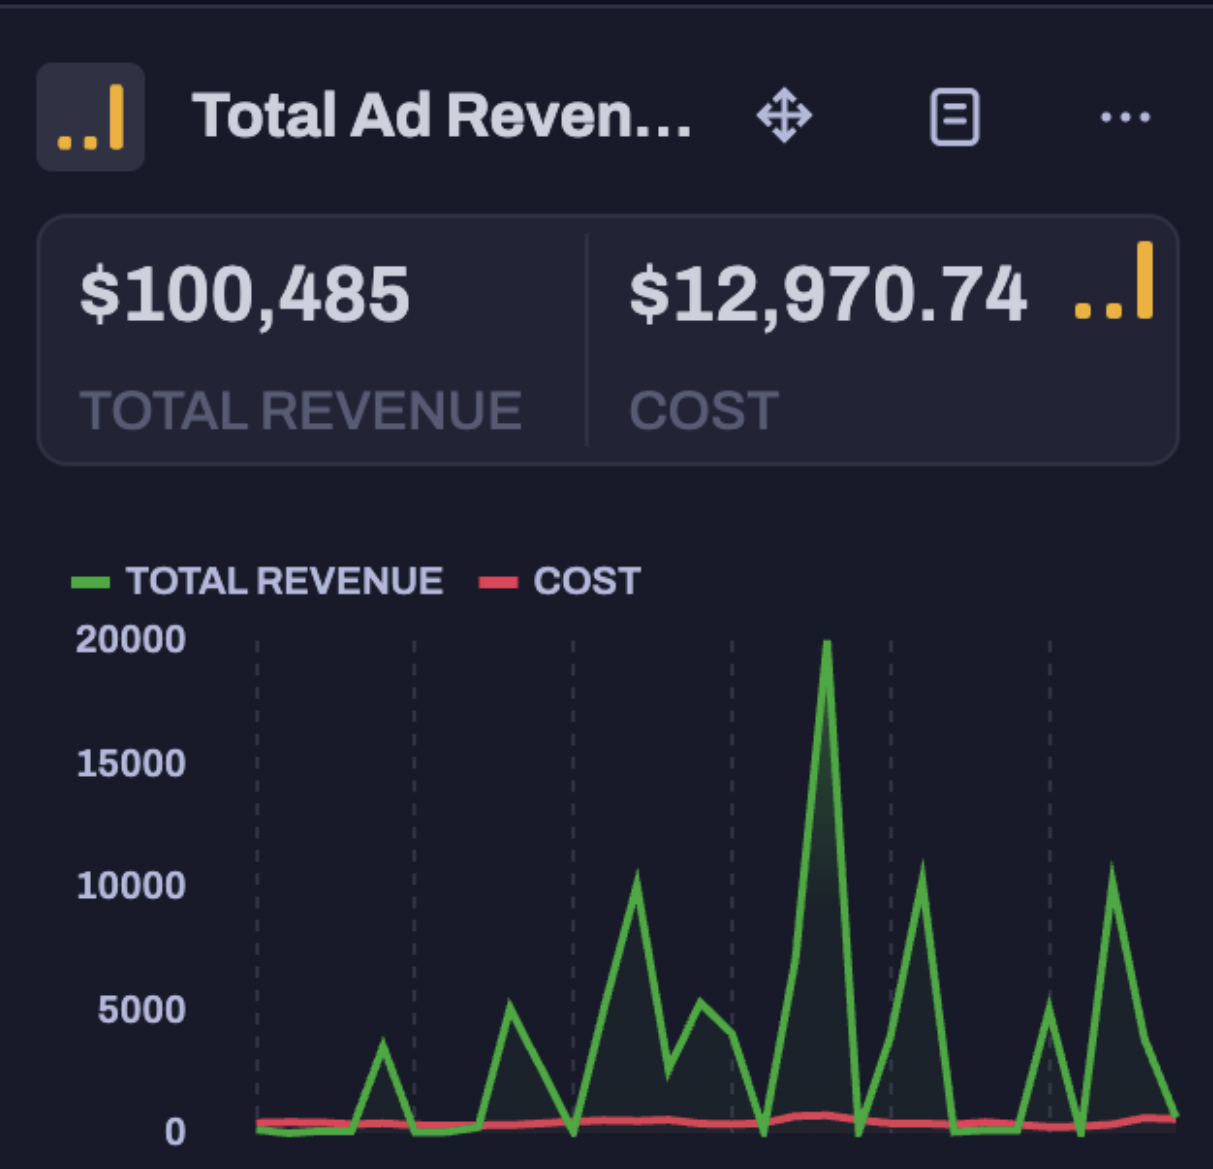
Hyros — $100K Ad Revenue vs $12.9K Cost
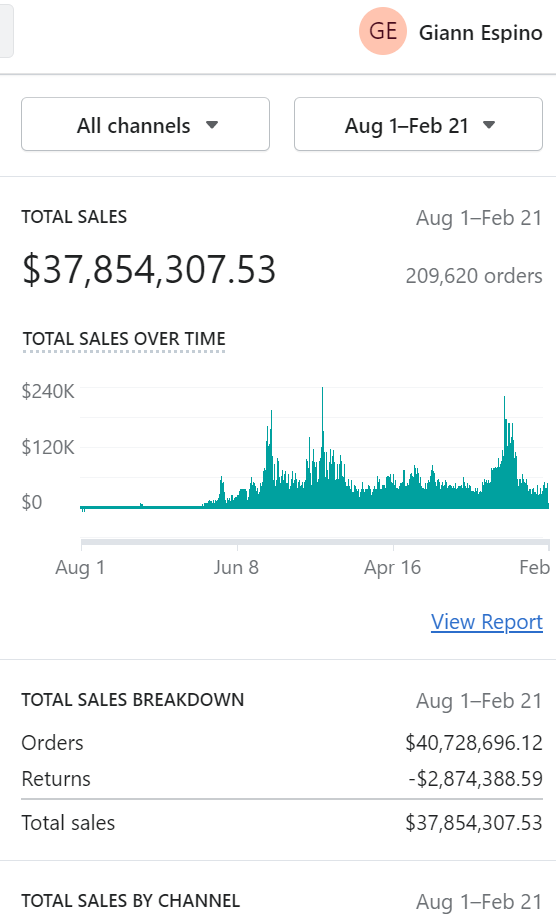
$37.8M All-Time Sales — 209K Orders
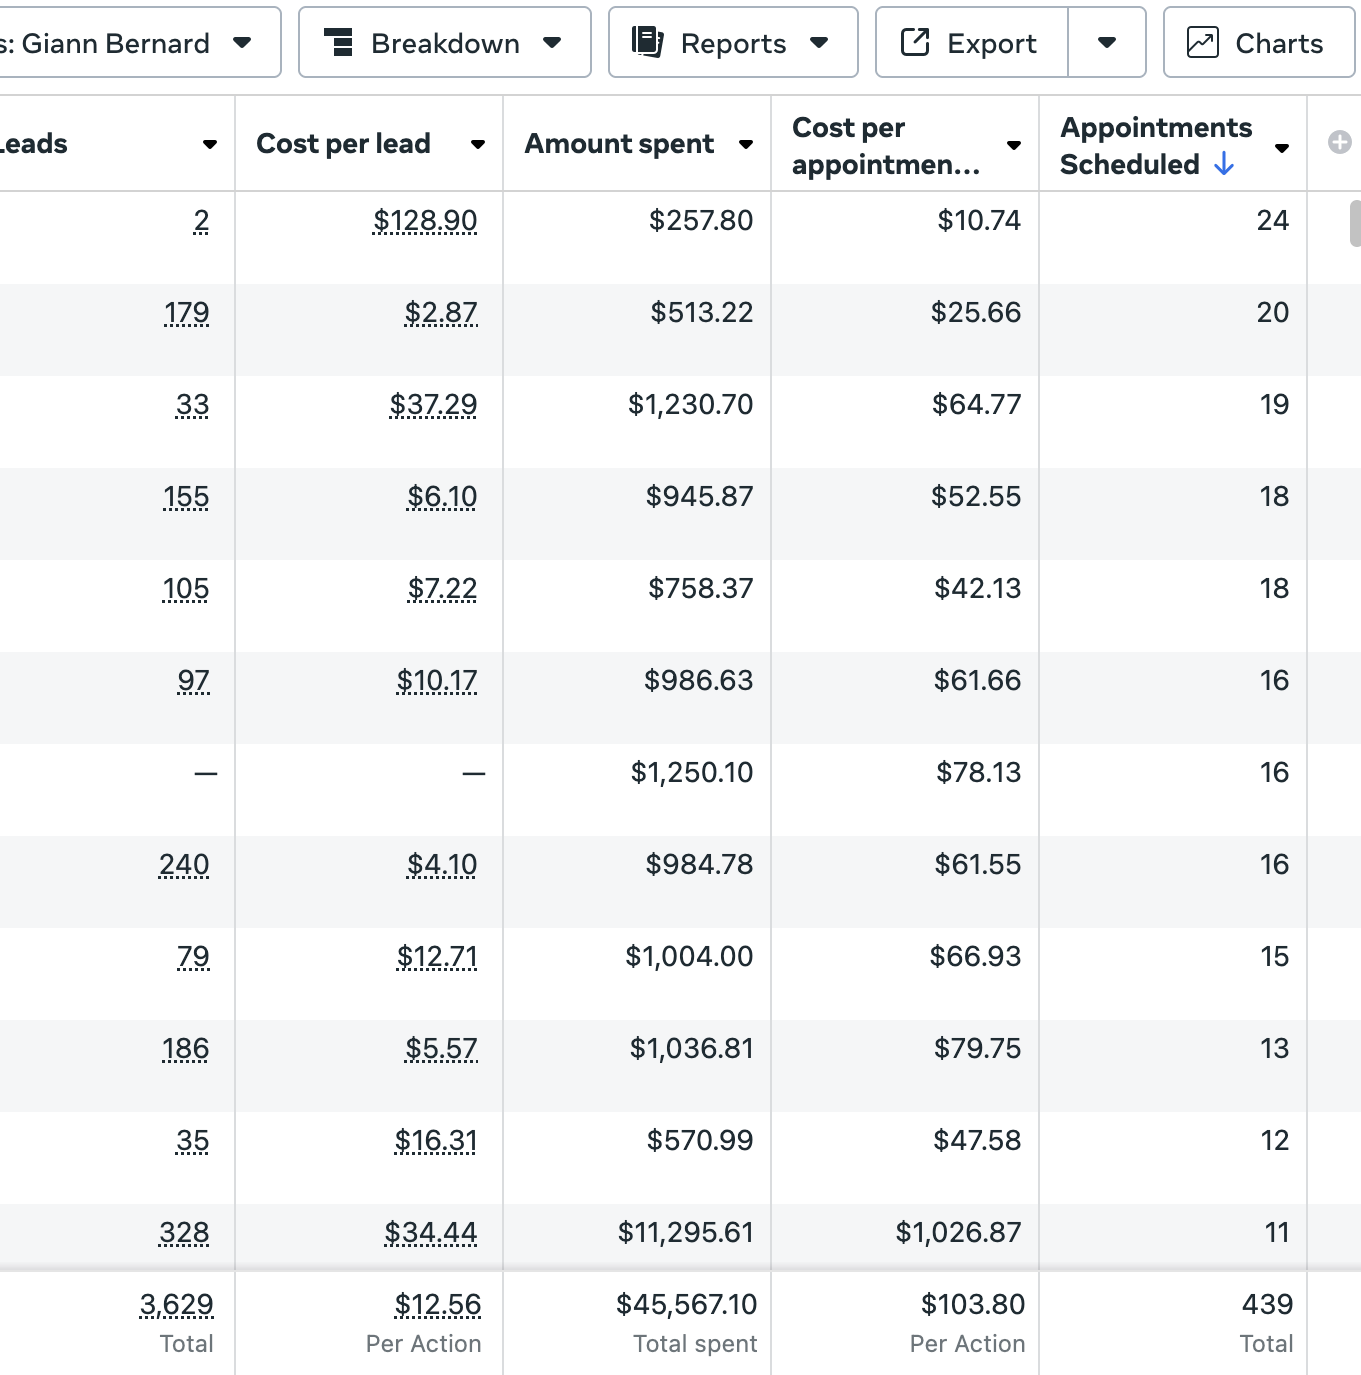
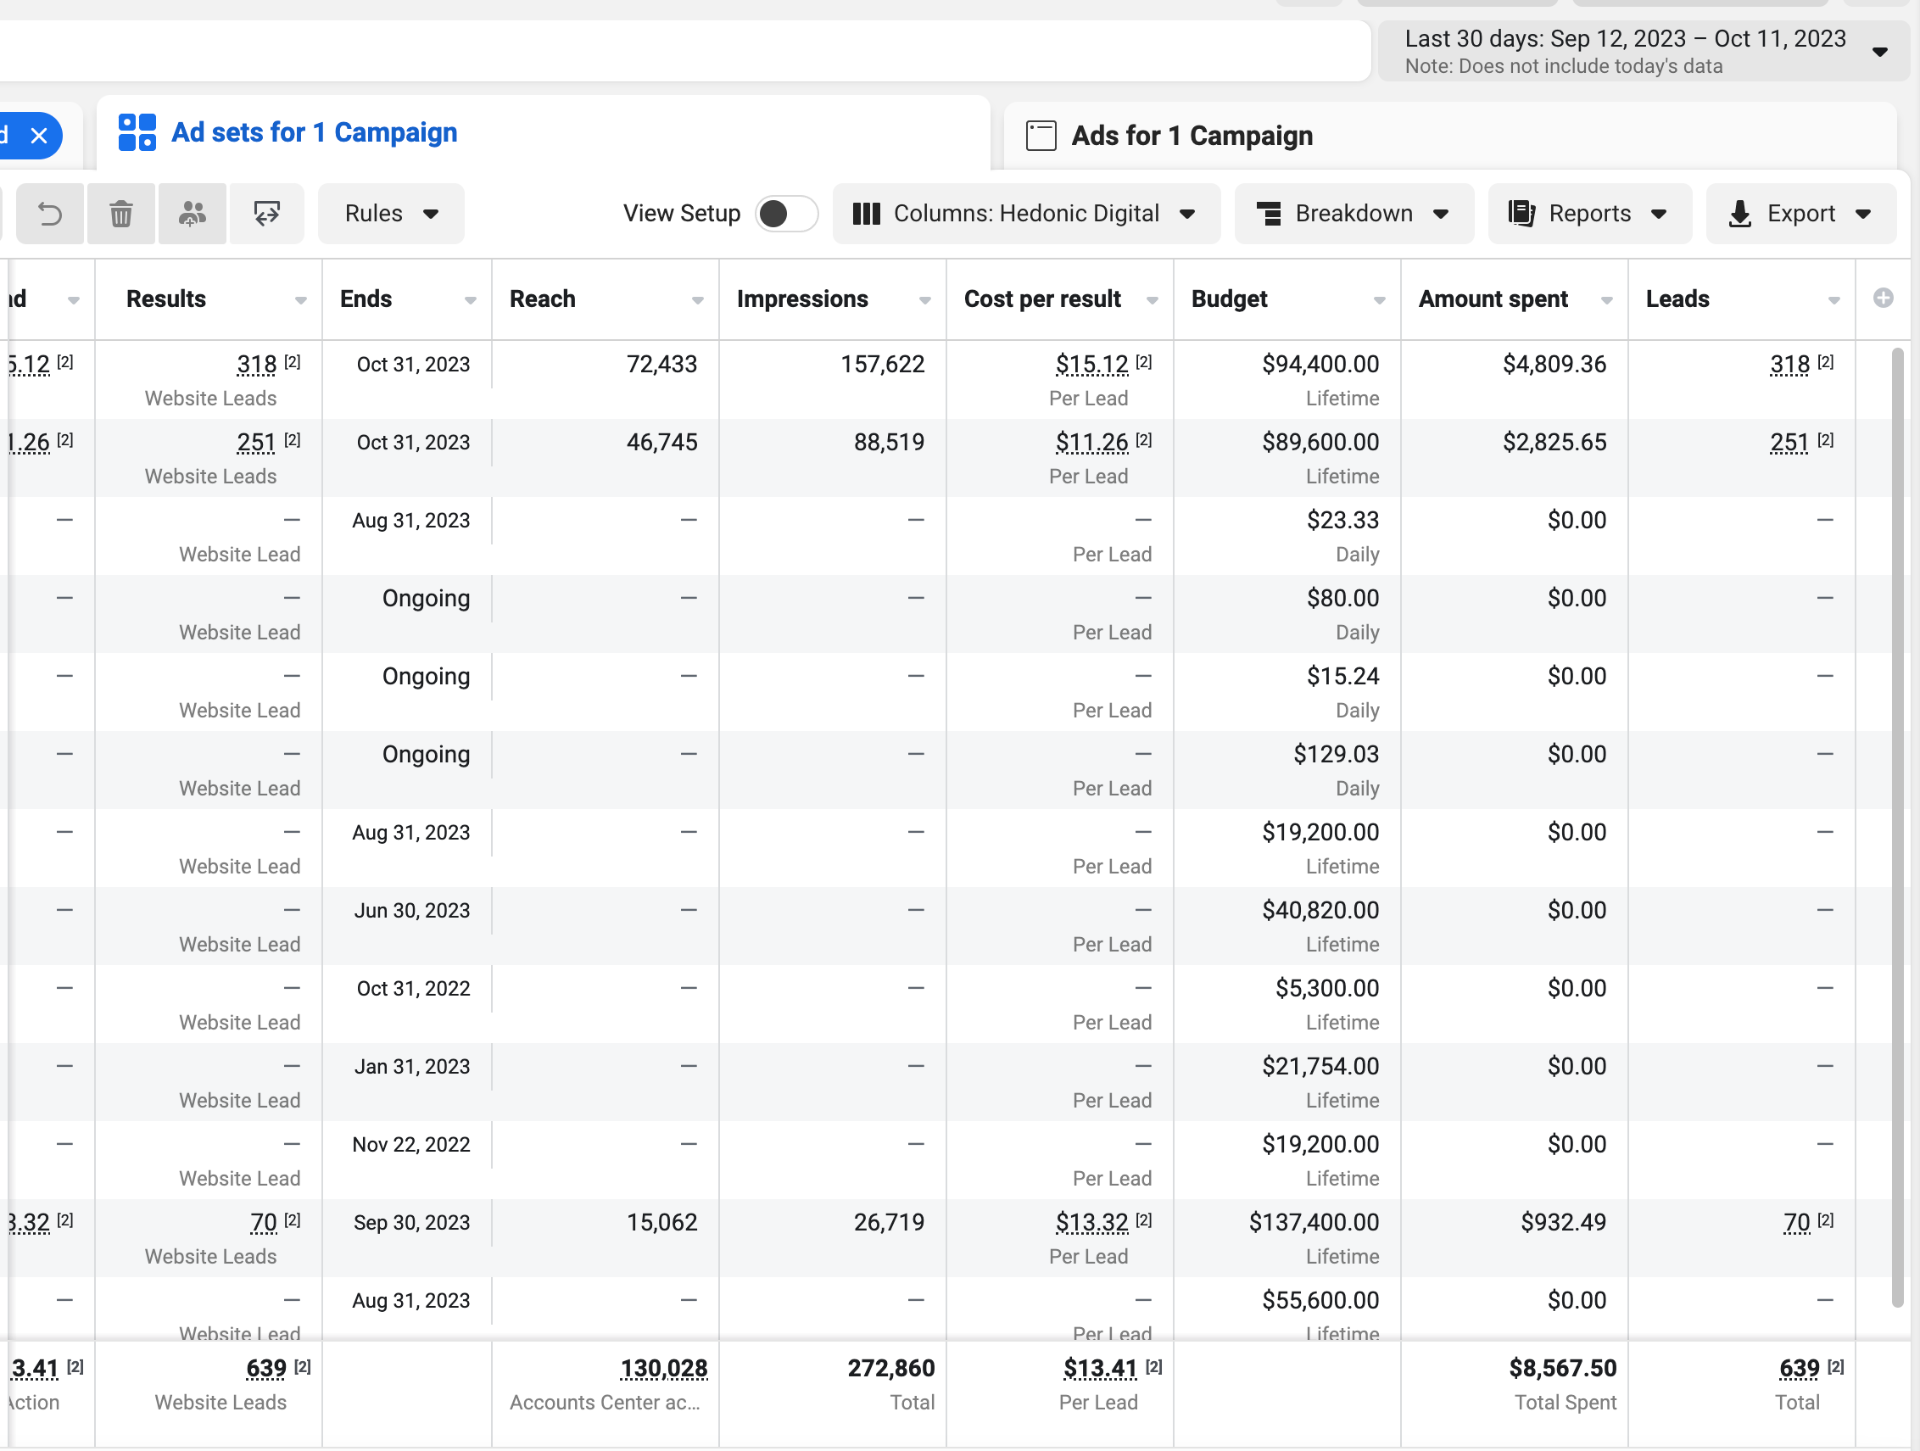
$45.5K Spent → 439 Appointments + 3,629 Leads
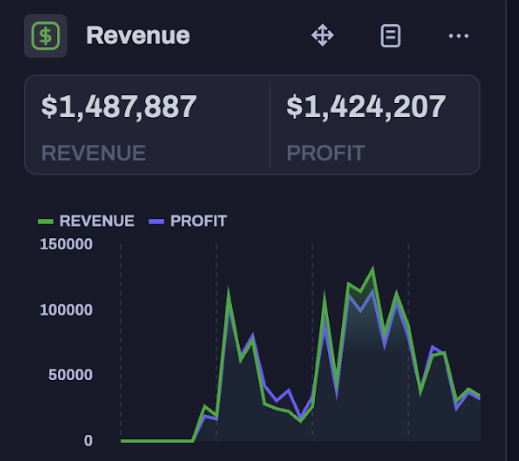
Hyros — $1.49M Revenue, $1.42M Profit

Hyros — 30-Day Weekly Stats: $113K Revenue, 109 Sales
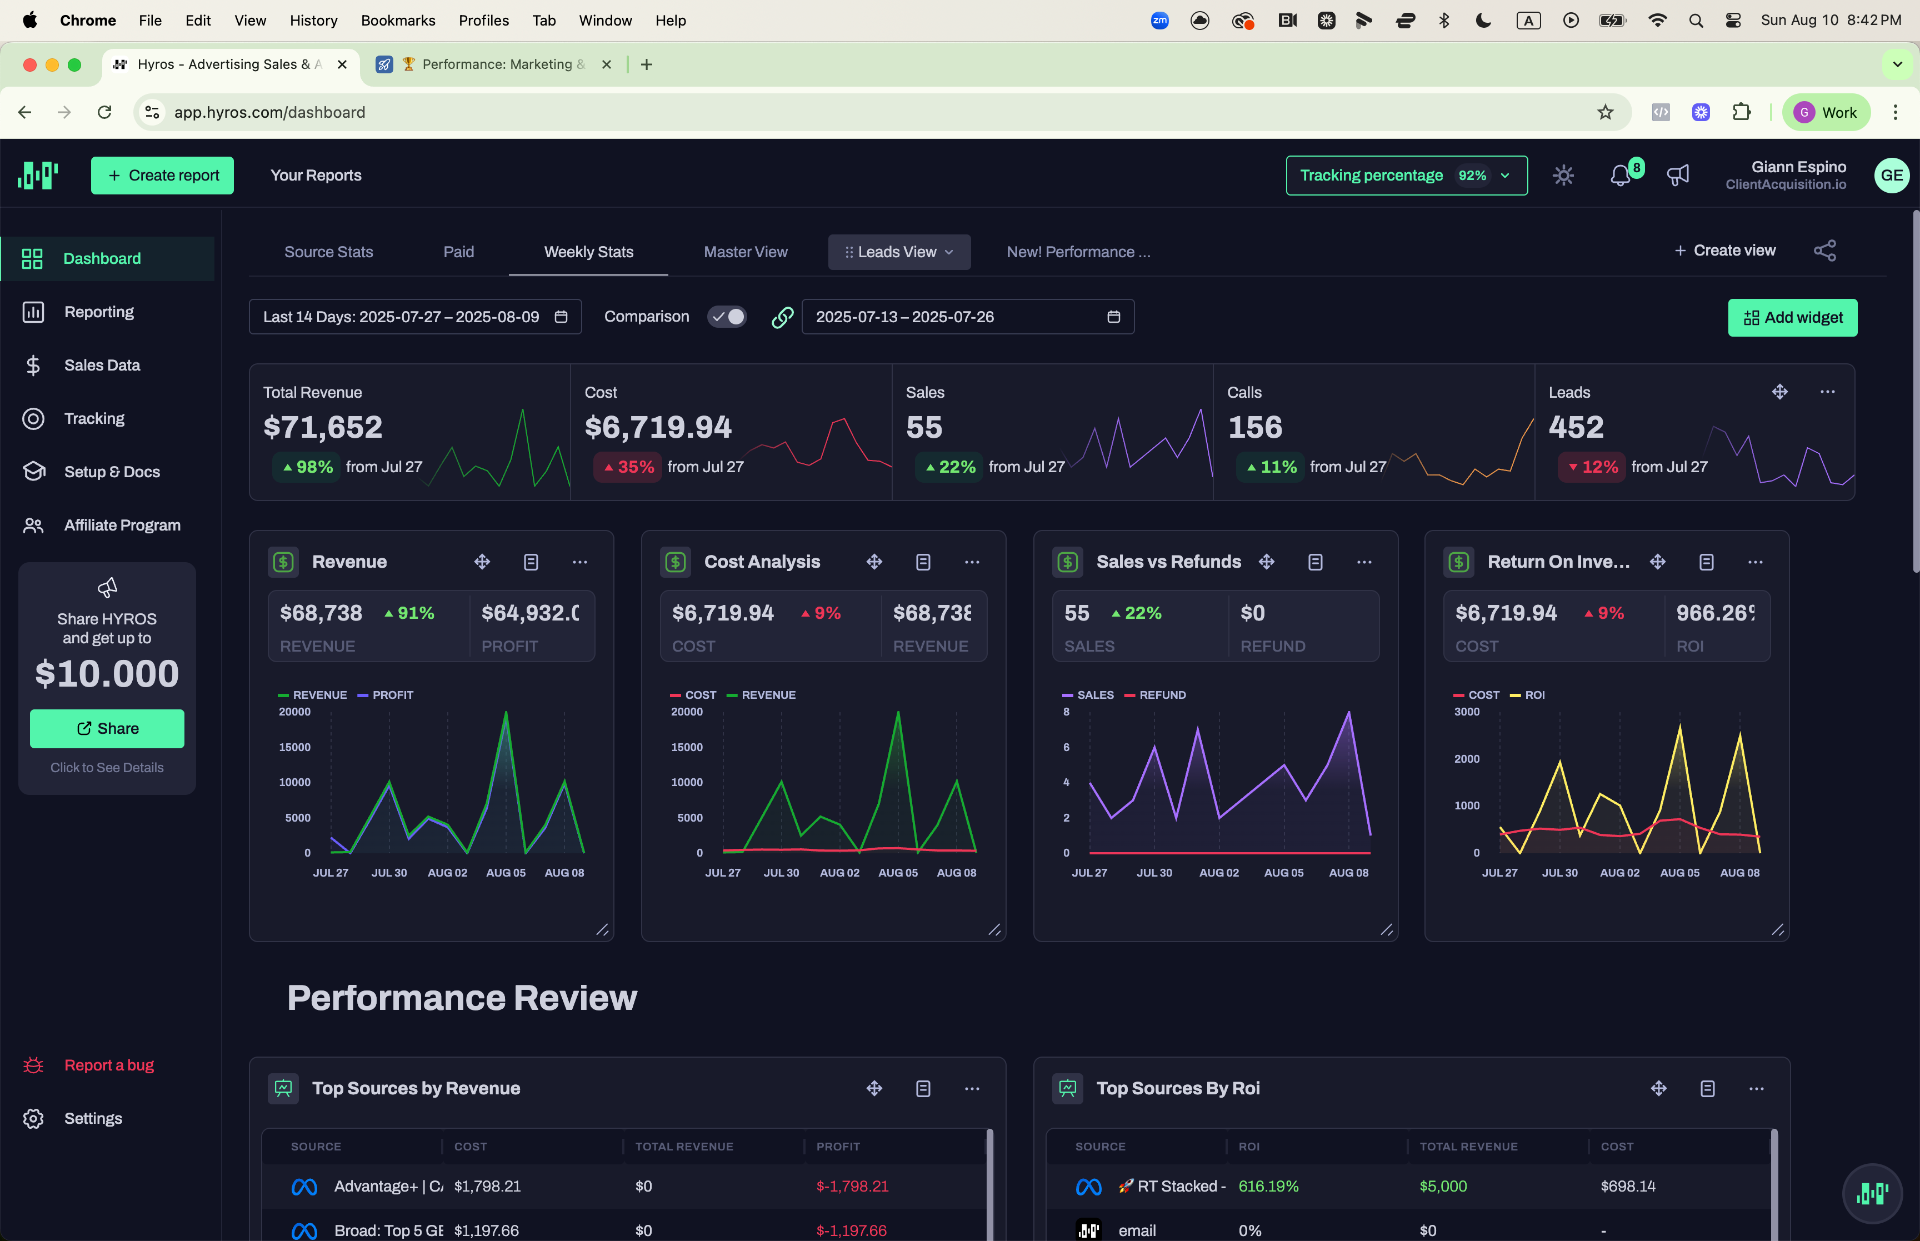
Hyros — 14-Day Stats: $71K Revenue, 55 Sales
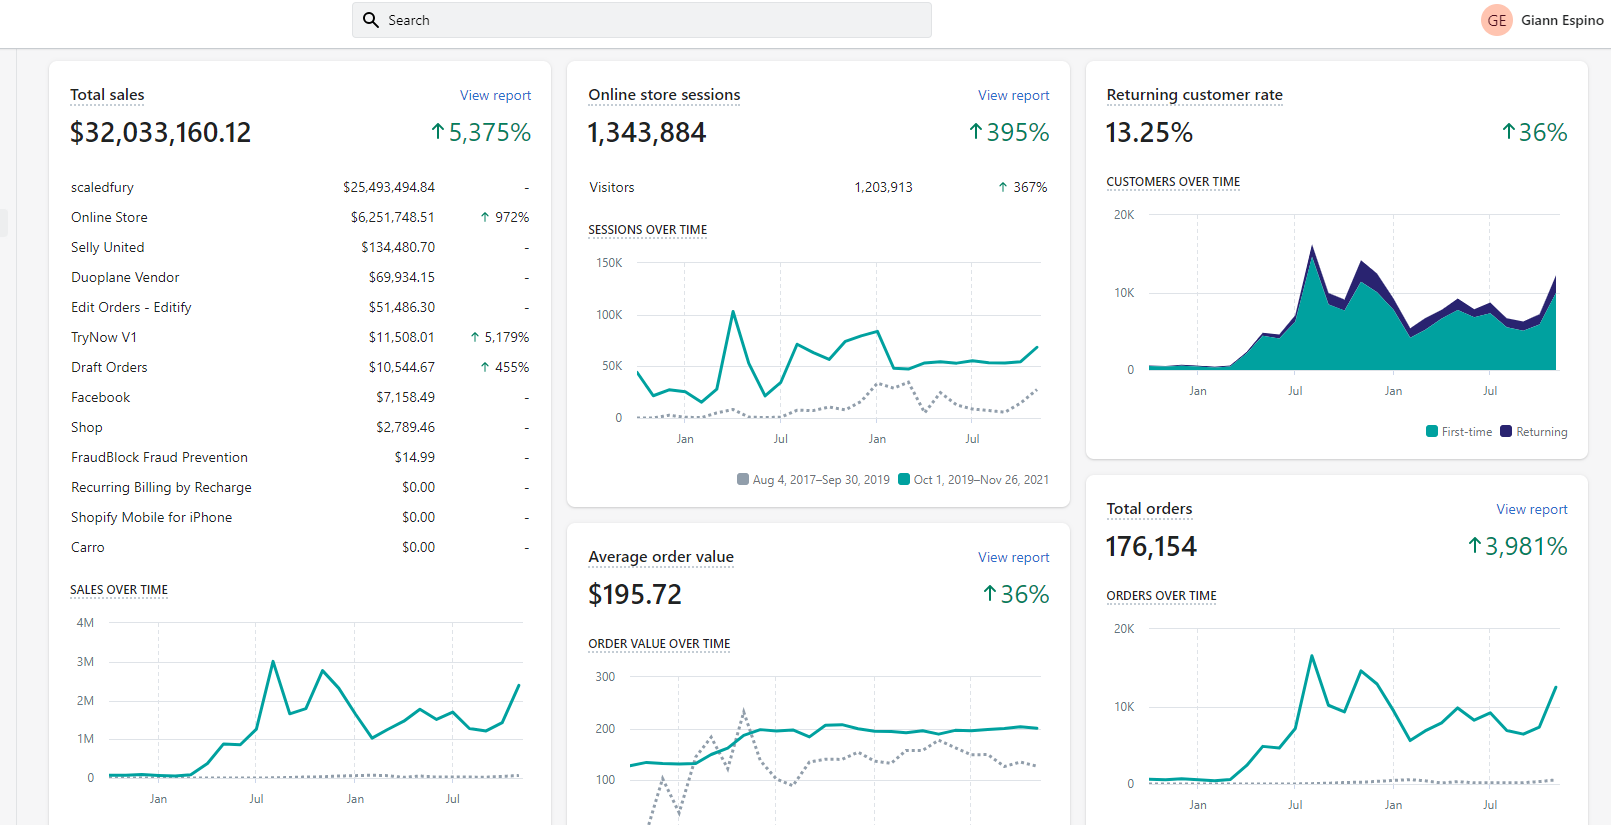
$32M+ Shopify Revenue — 176K Orders (All-Time)
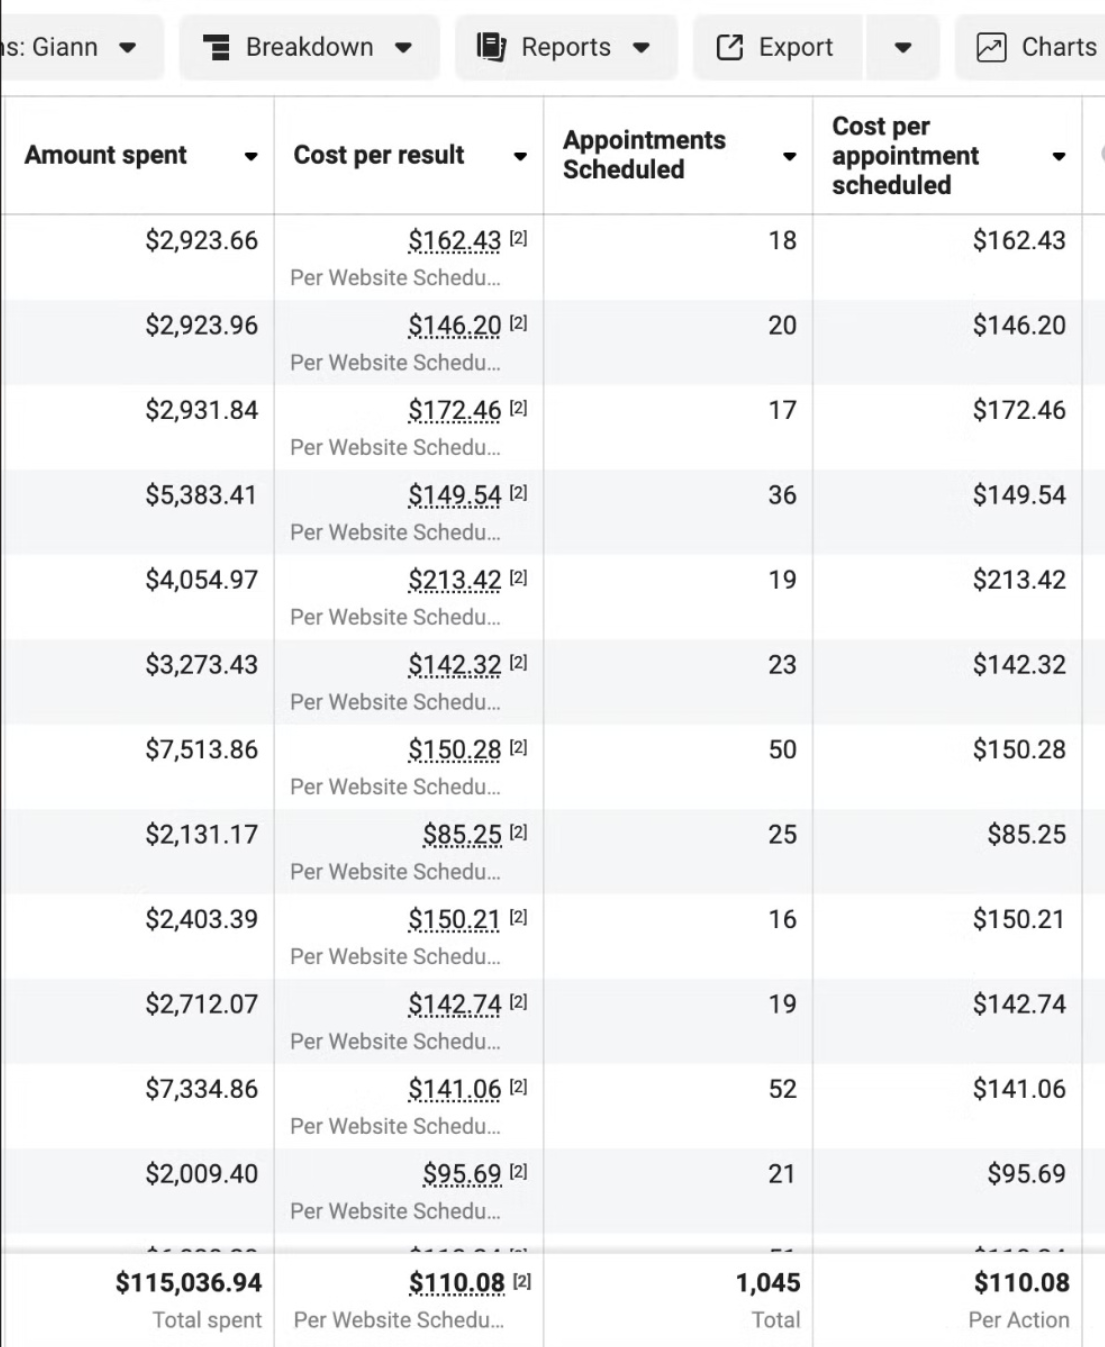
$115K Spent → 1,045 Booked Calls
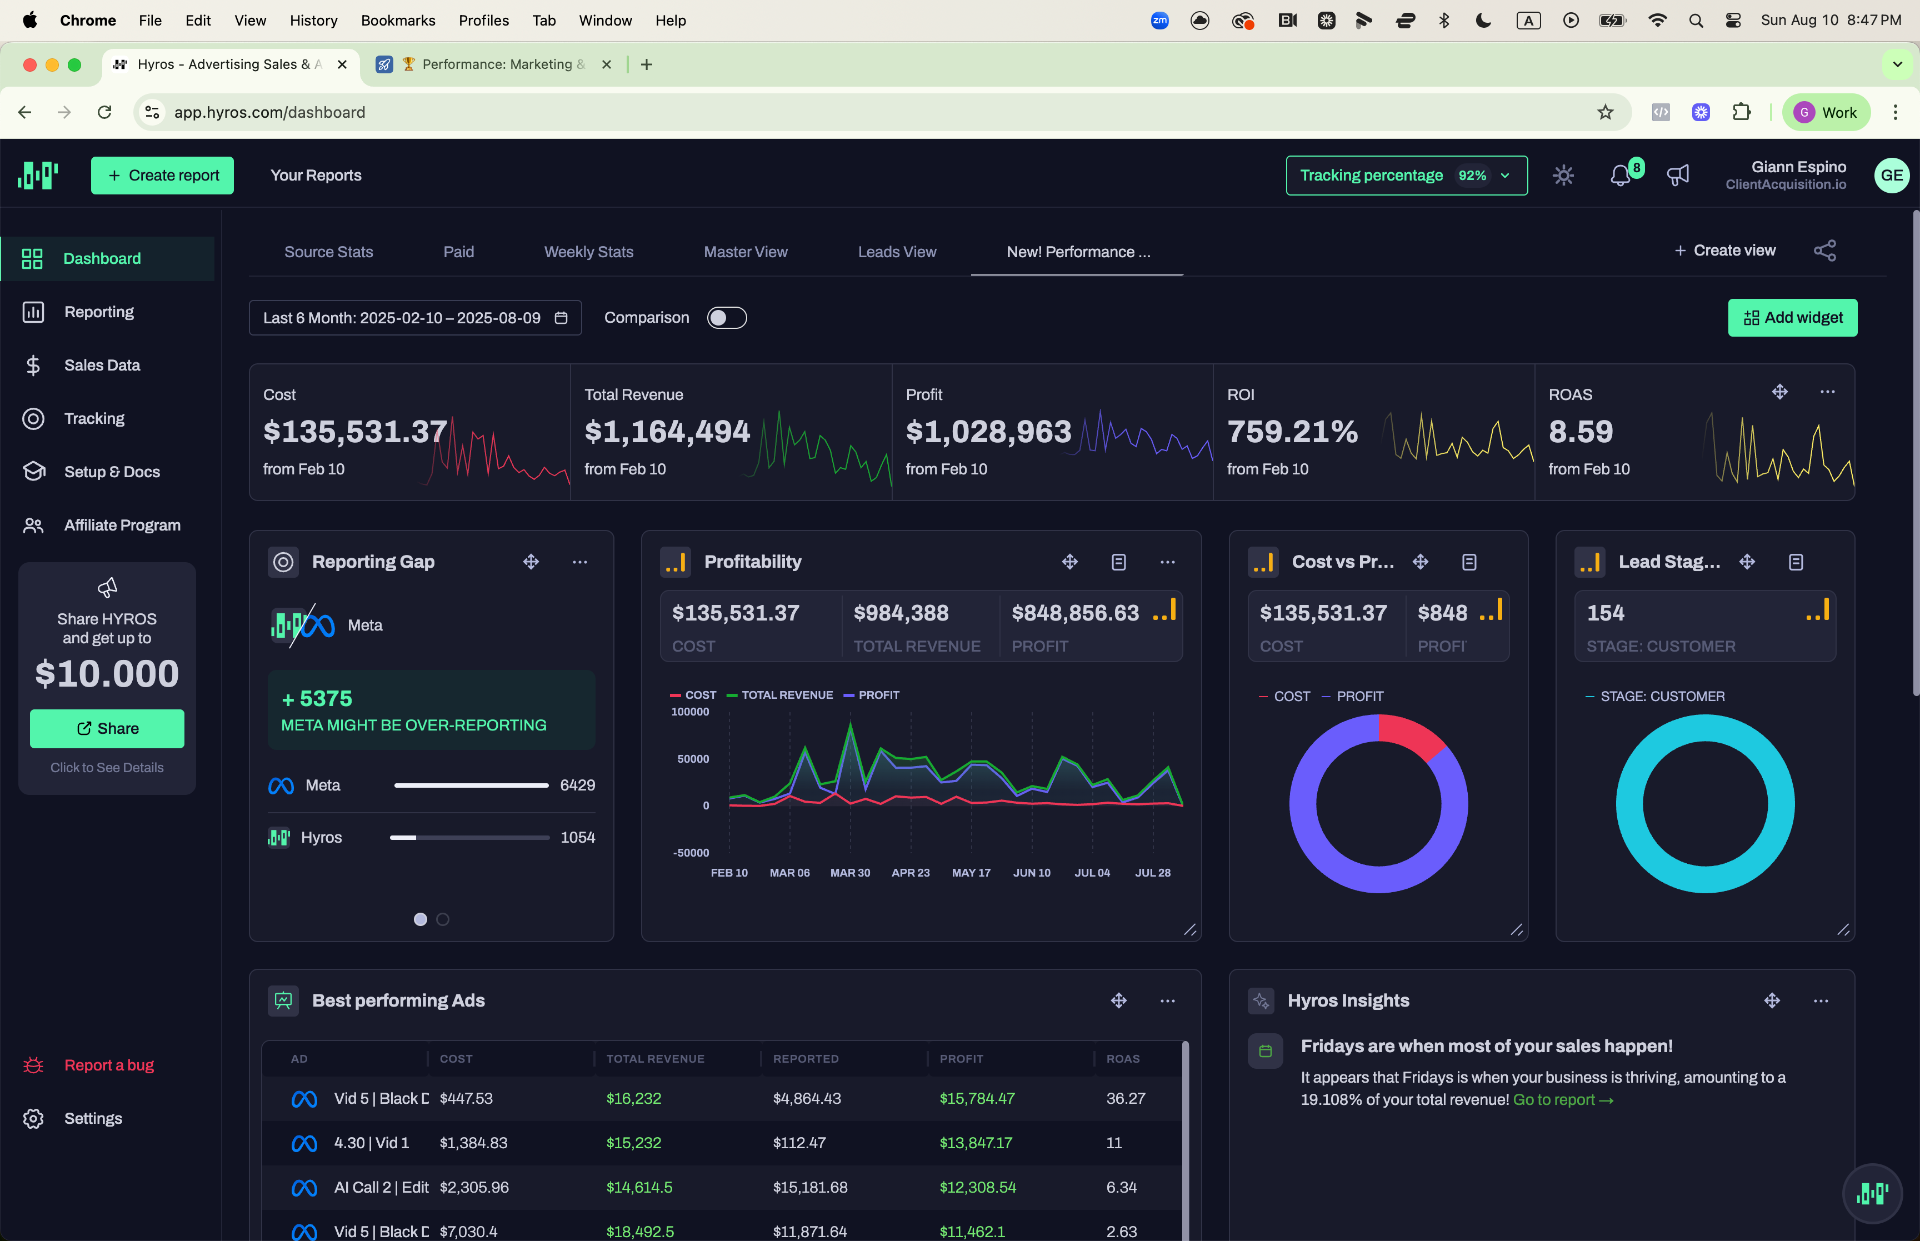
Hyros — 6-Month Performance: 8.59 ROAS, $1.02M Profit
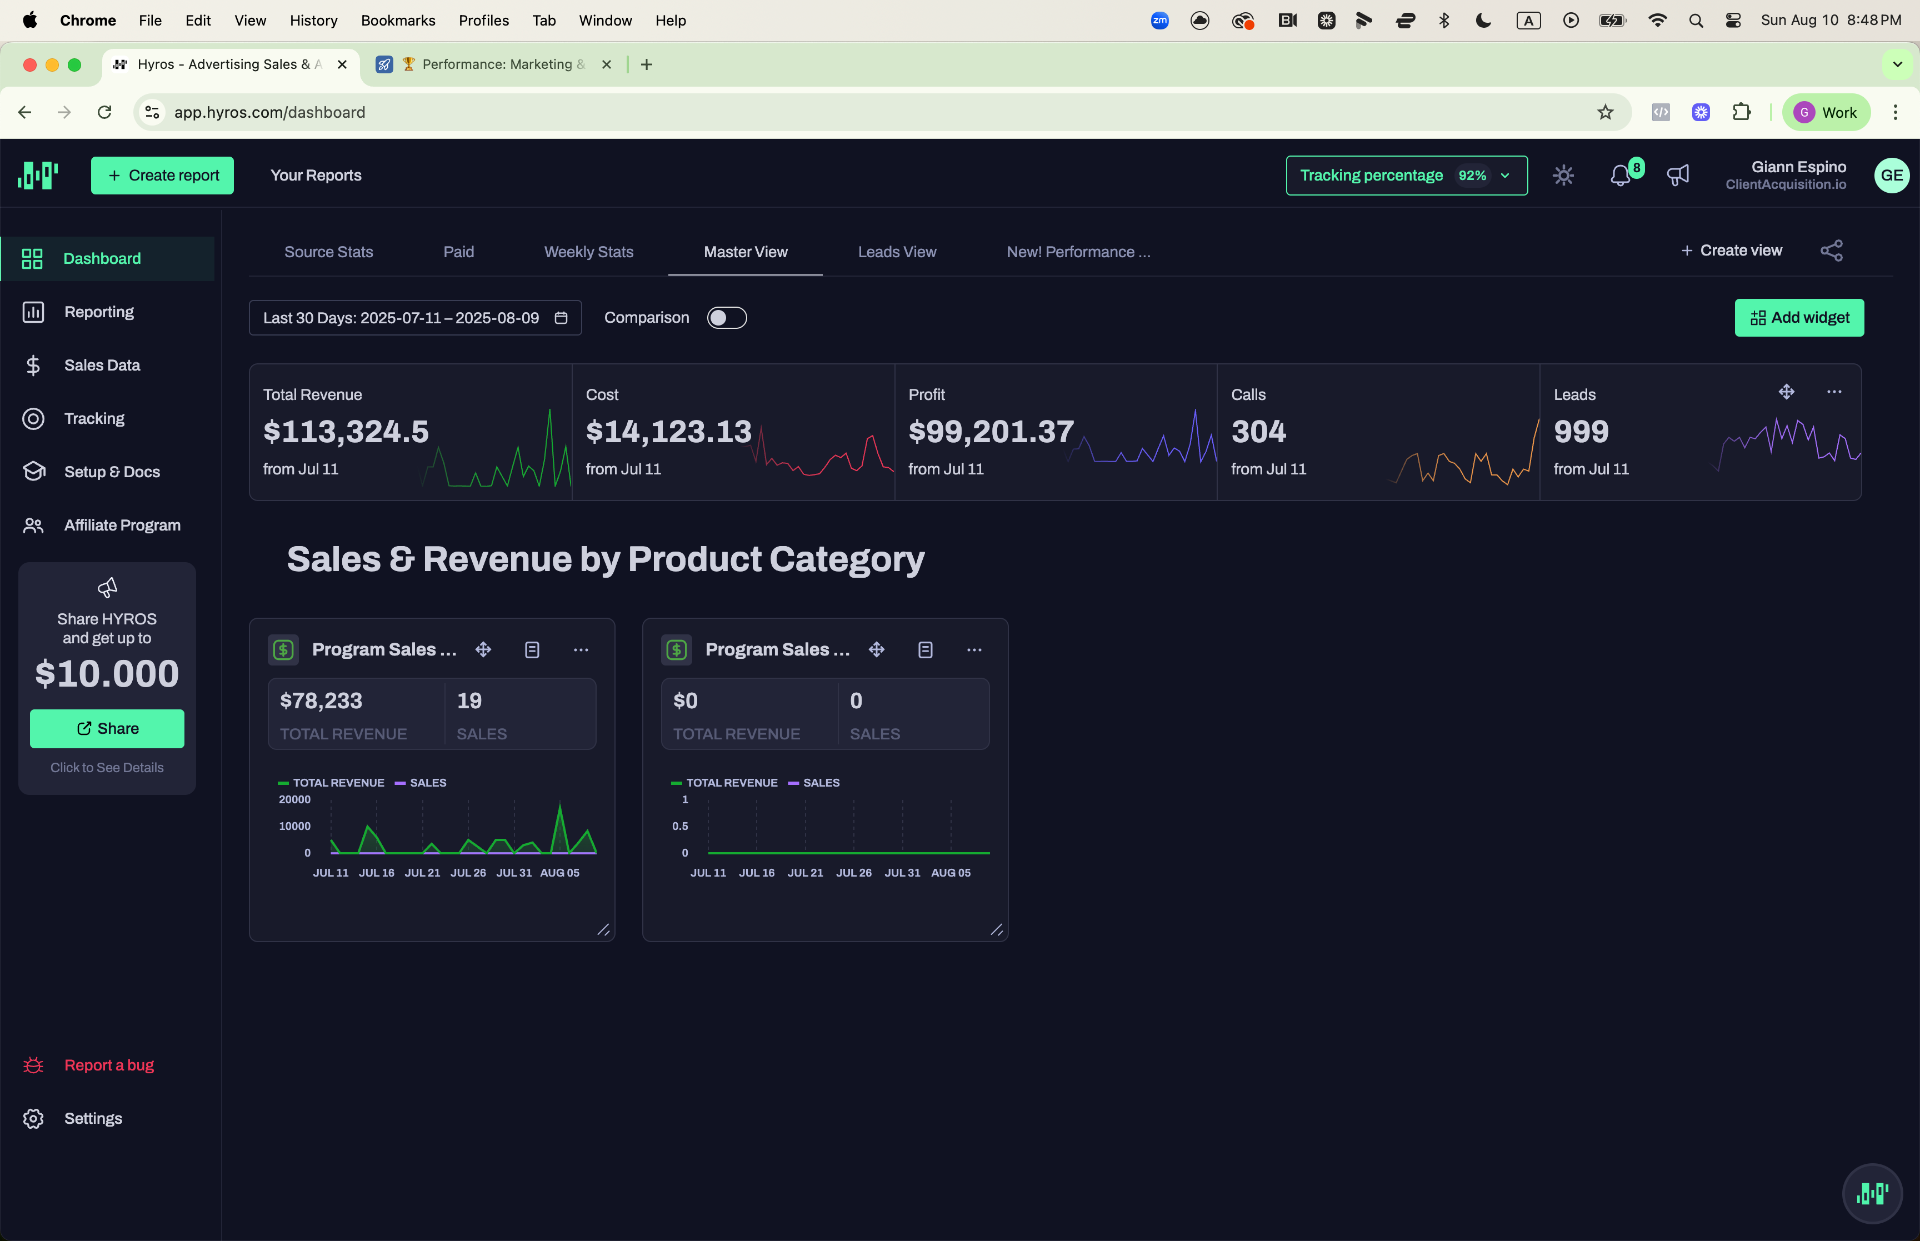
Hyros — 30-Day Master View: $113K Revenue, 304 Calls

Hyros — 7-Day Weekly Stats (Alt): $41K Revenue, 1,079x ROI
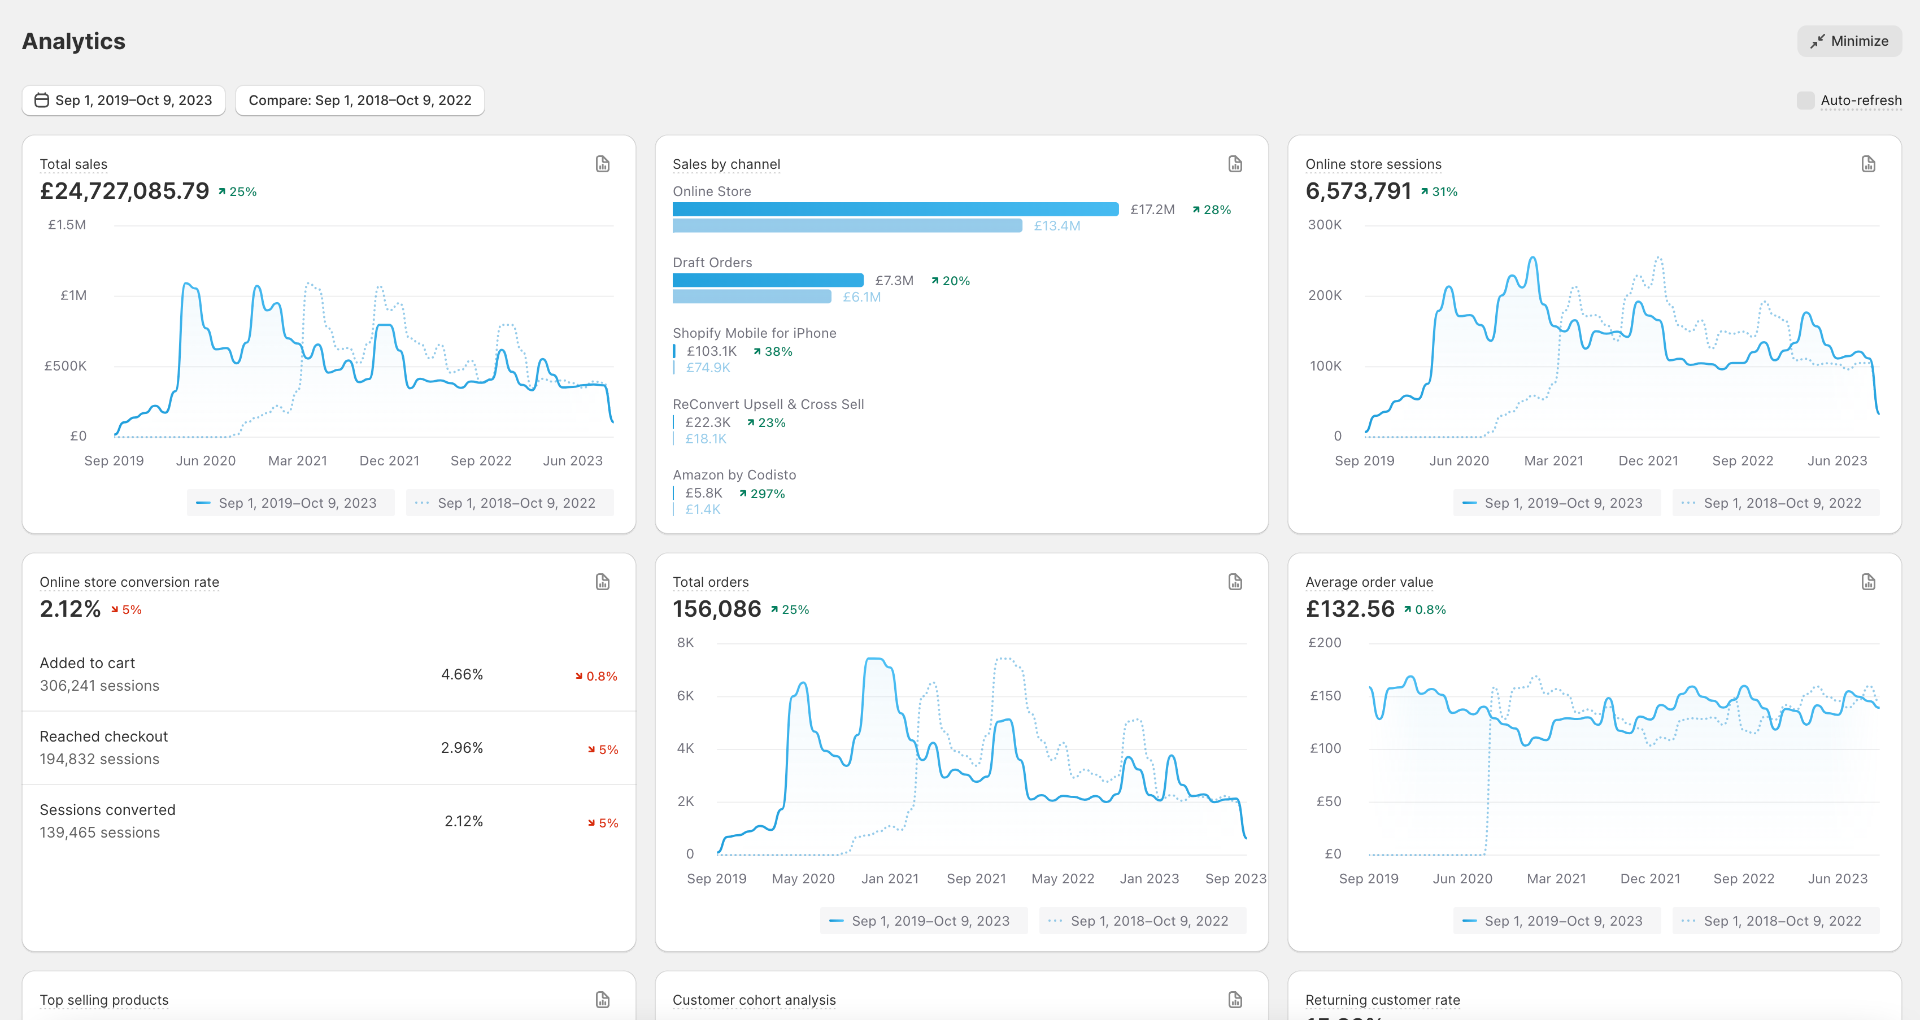
£24.7M Shopify Revenue — 156K Orders
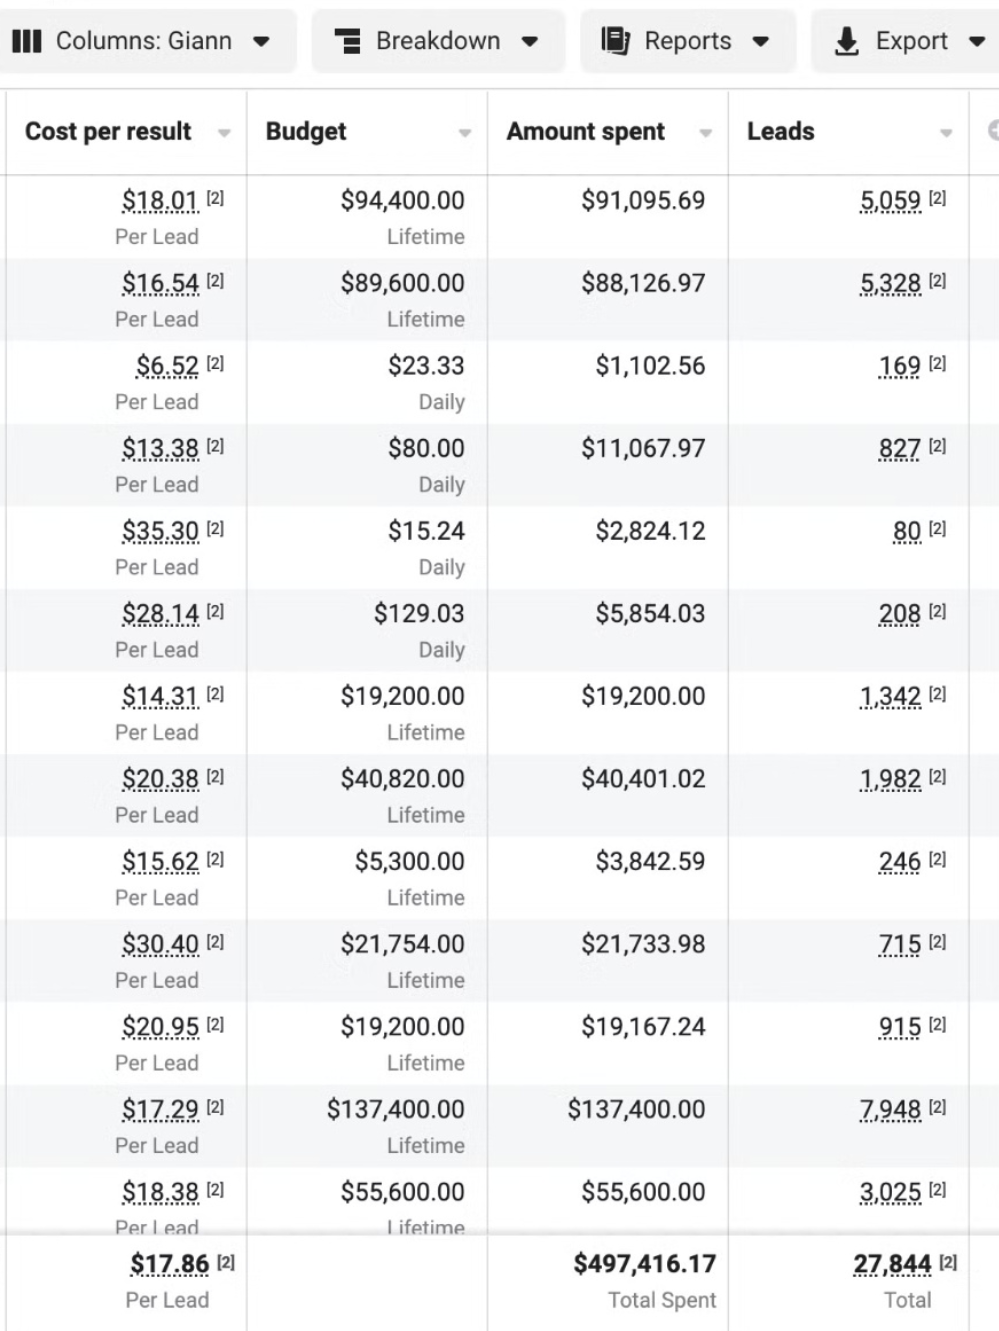
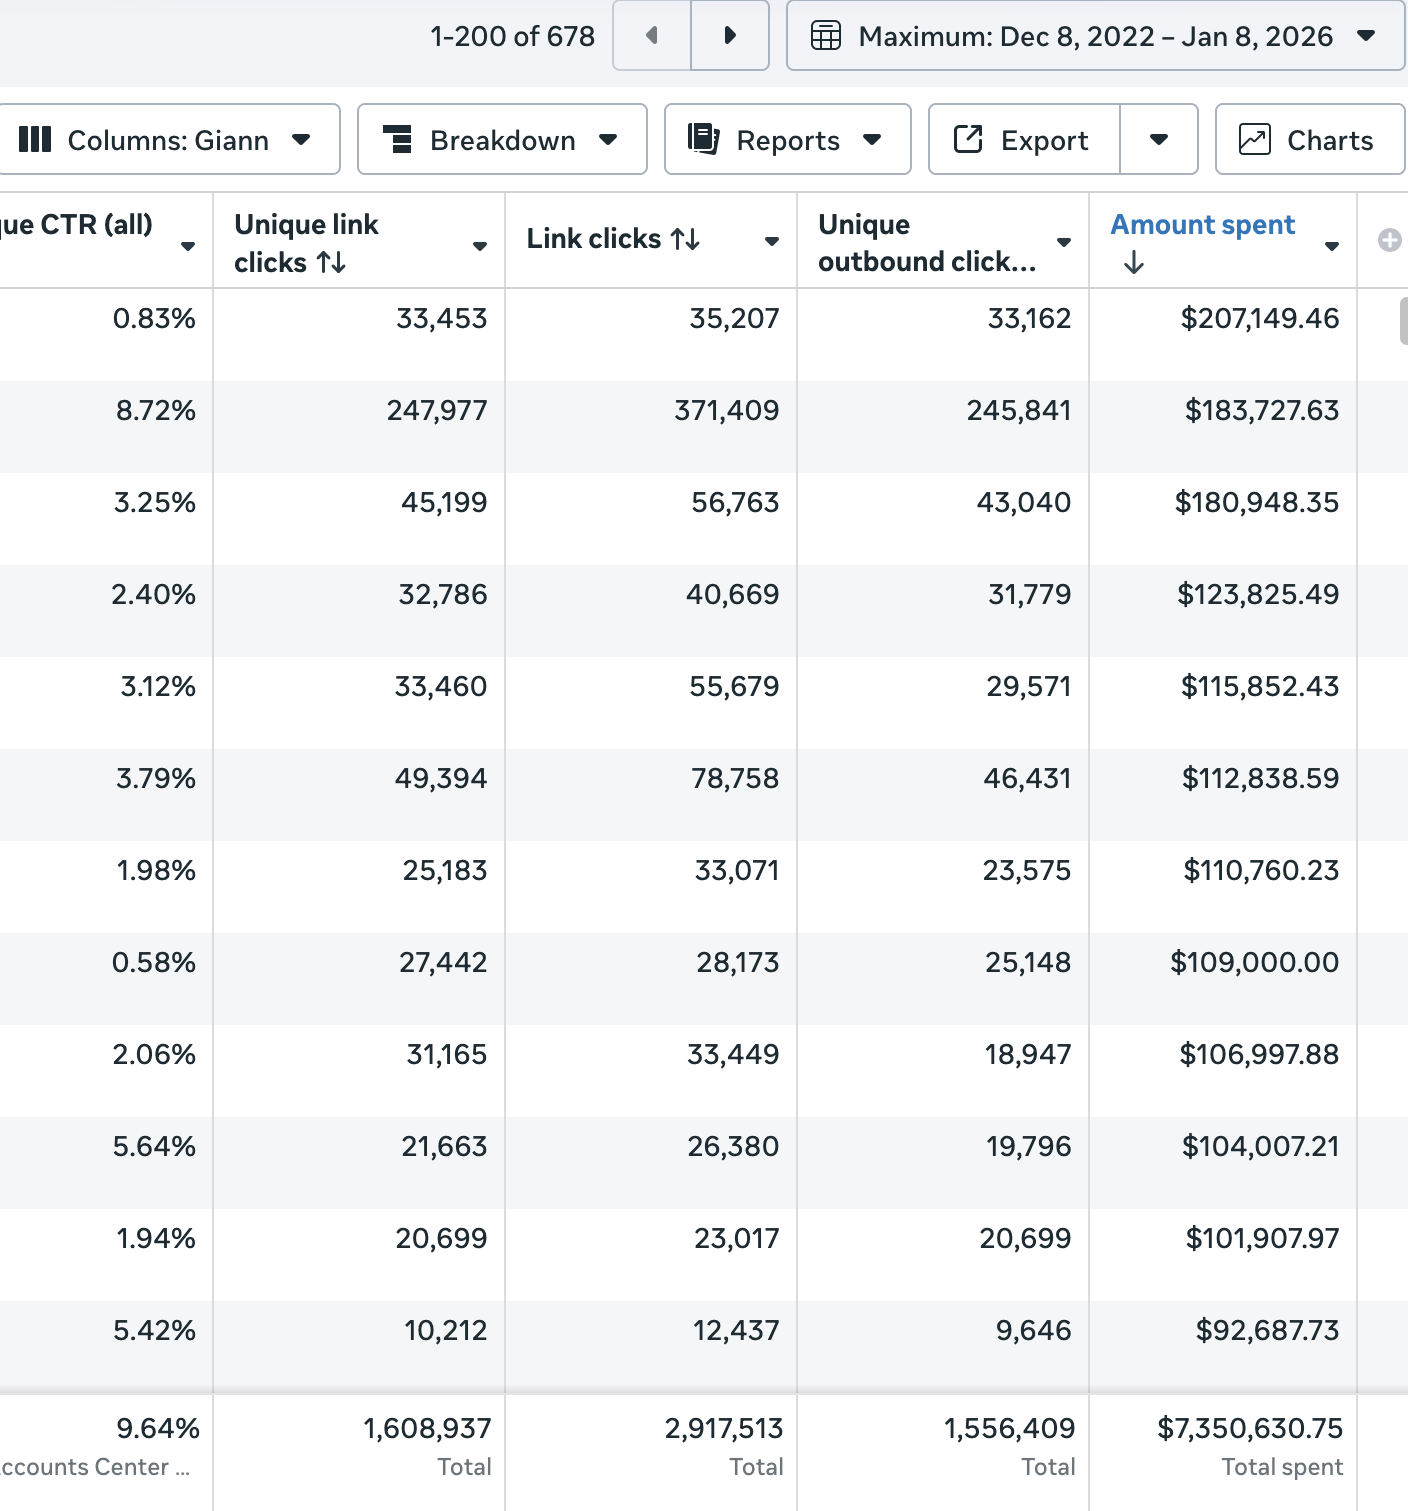
$497K Spent → 27,844 B2B Leads
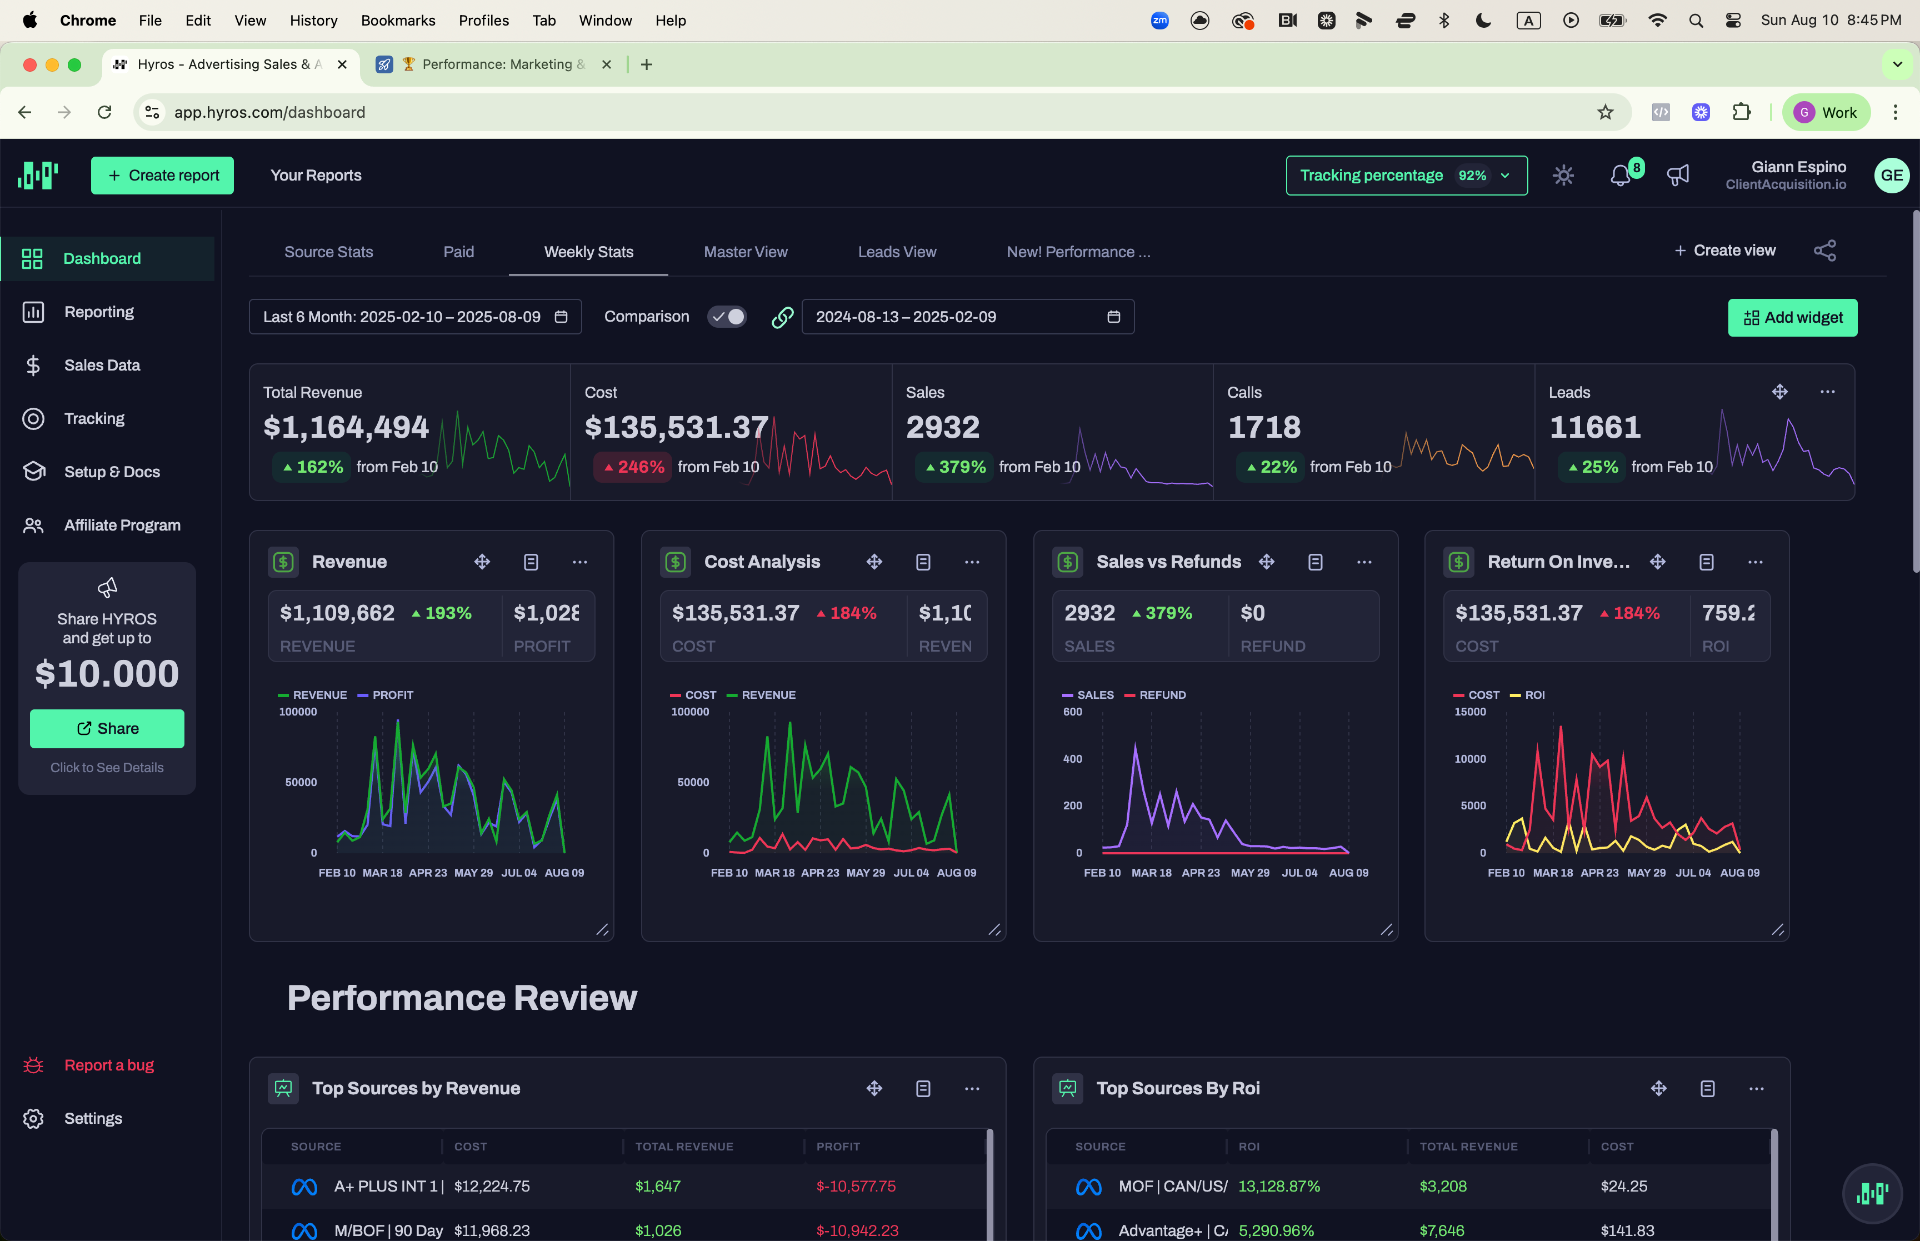
Hyros — 6-Month Weekly Stats: $1.16M Revenue, 2,932 Sales
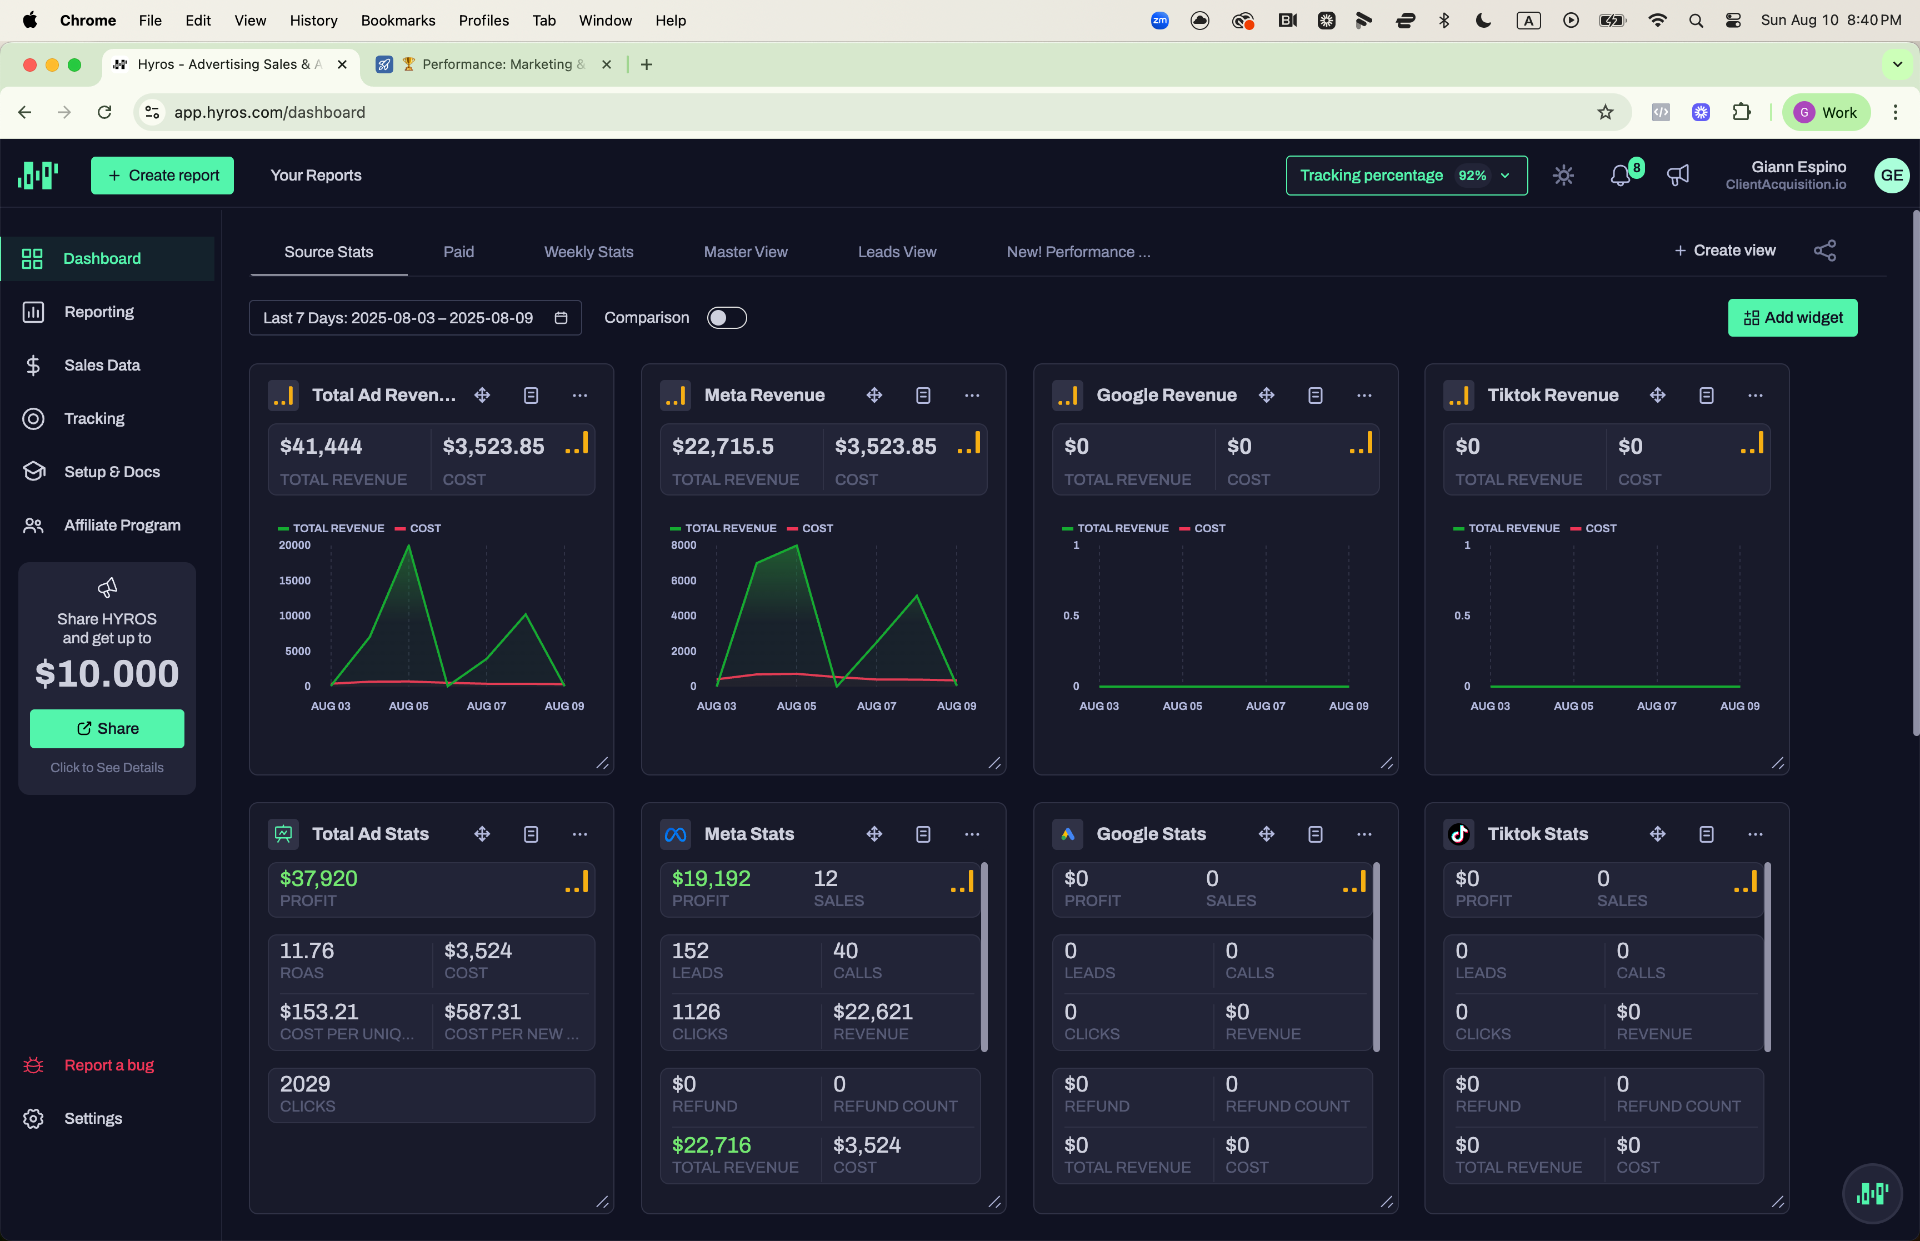
Hyros — 7-Day Source Stats: $41K Revenue

Hyros — 30-Day Weekly Stats (Alt): $113K Revenue, 702x ROI
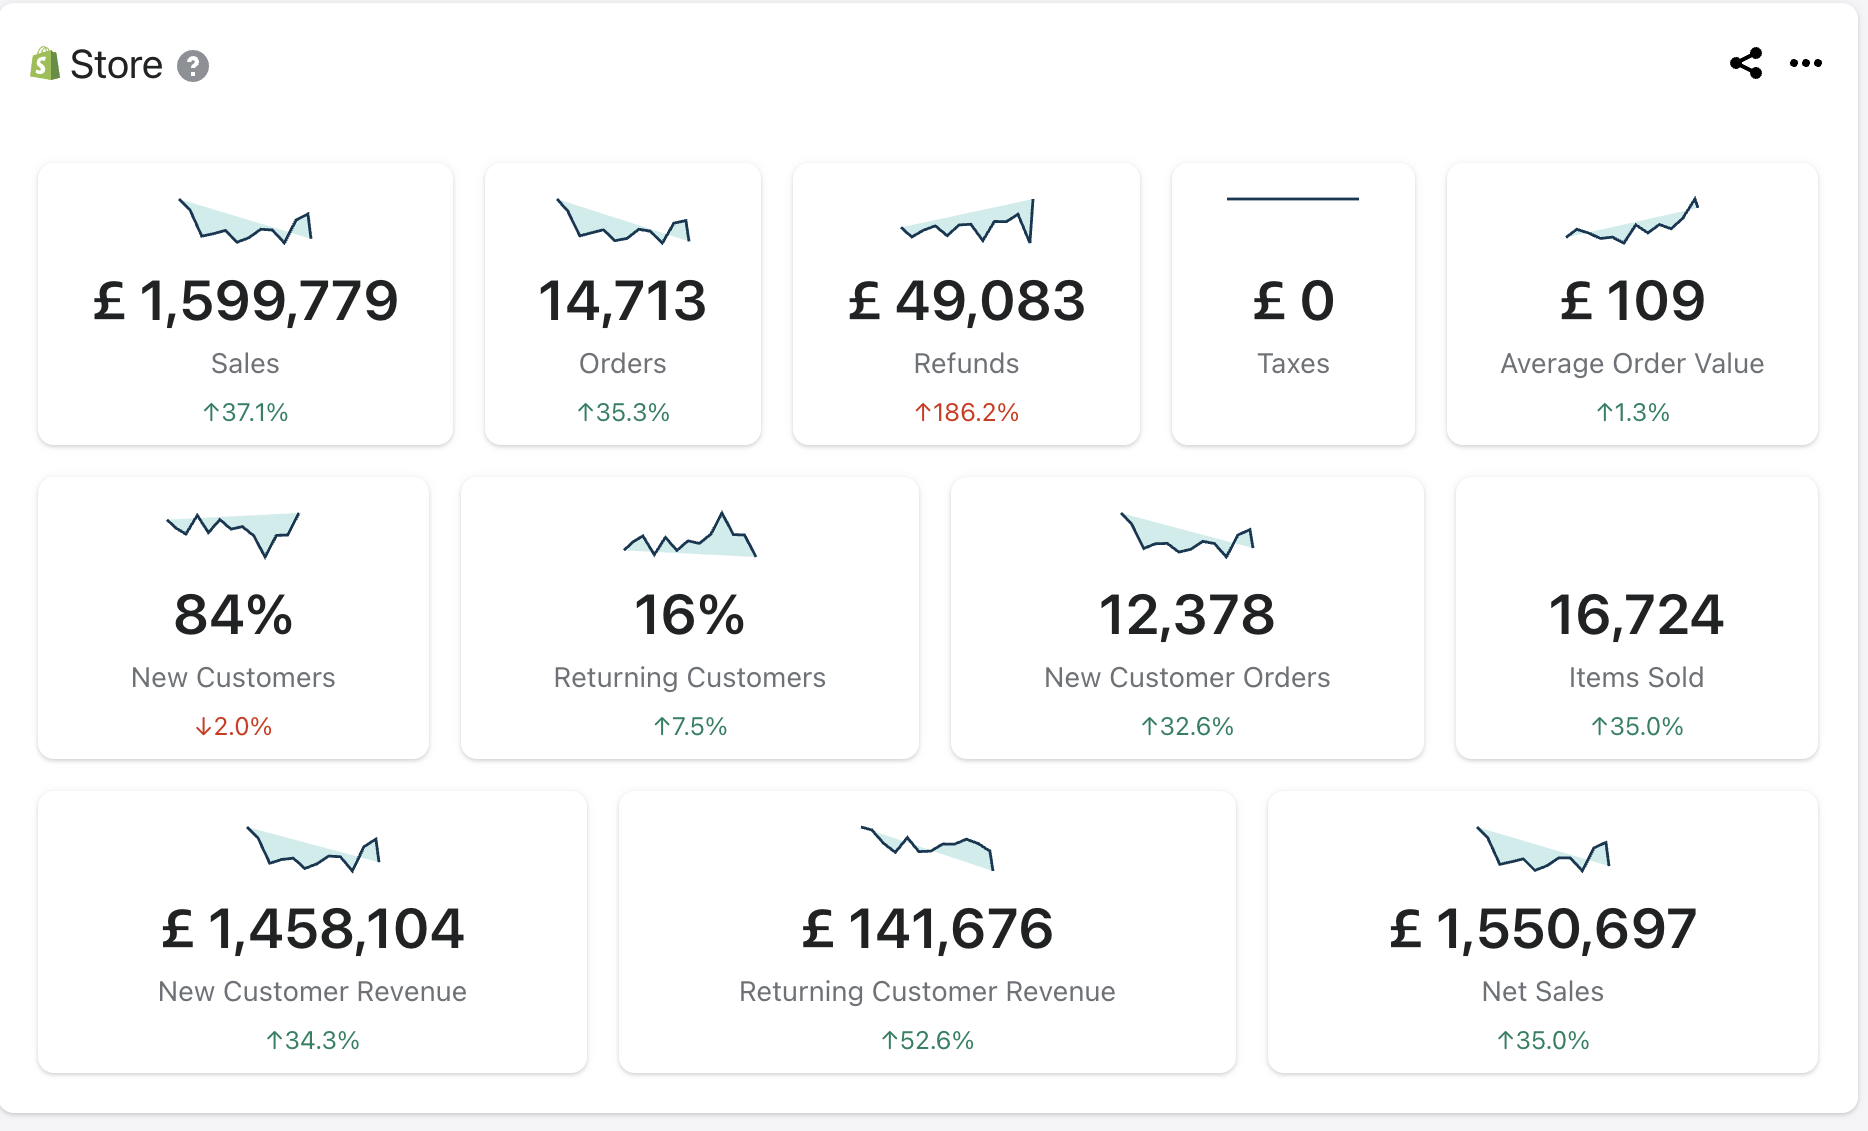
£1.6M Sales — Triple Whale Store Overview (14.7K Orders)
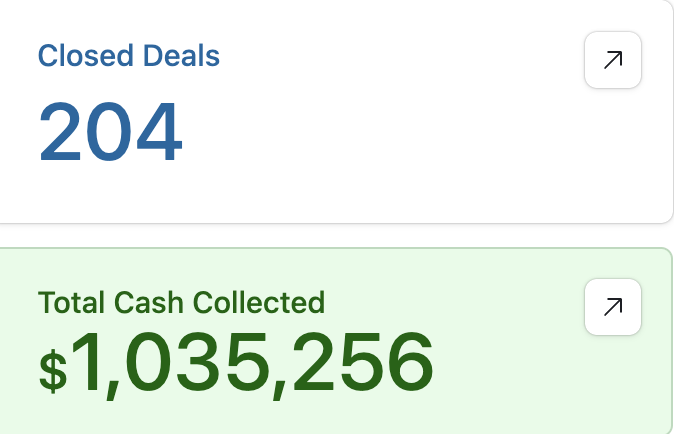
$1M+ Cash Collected — 204 Deals Closed
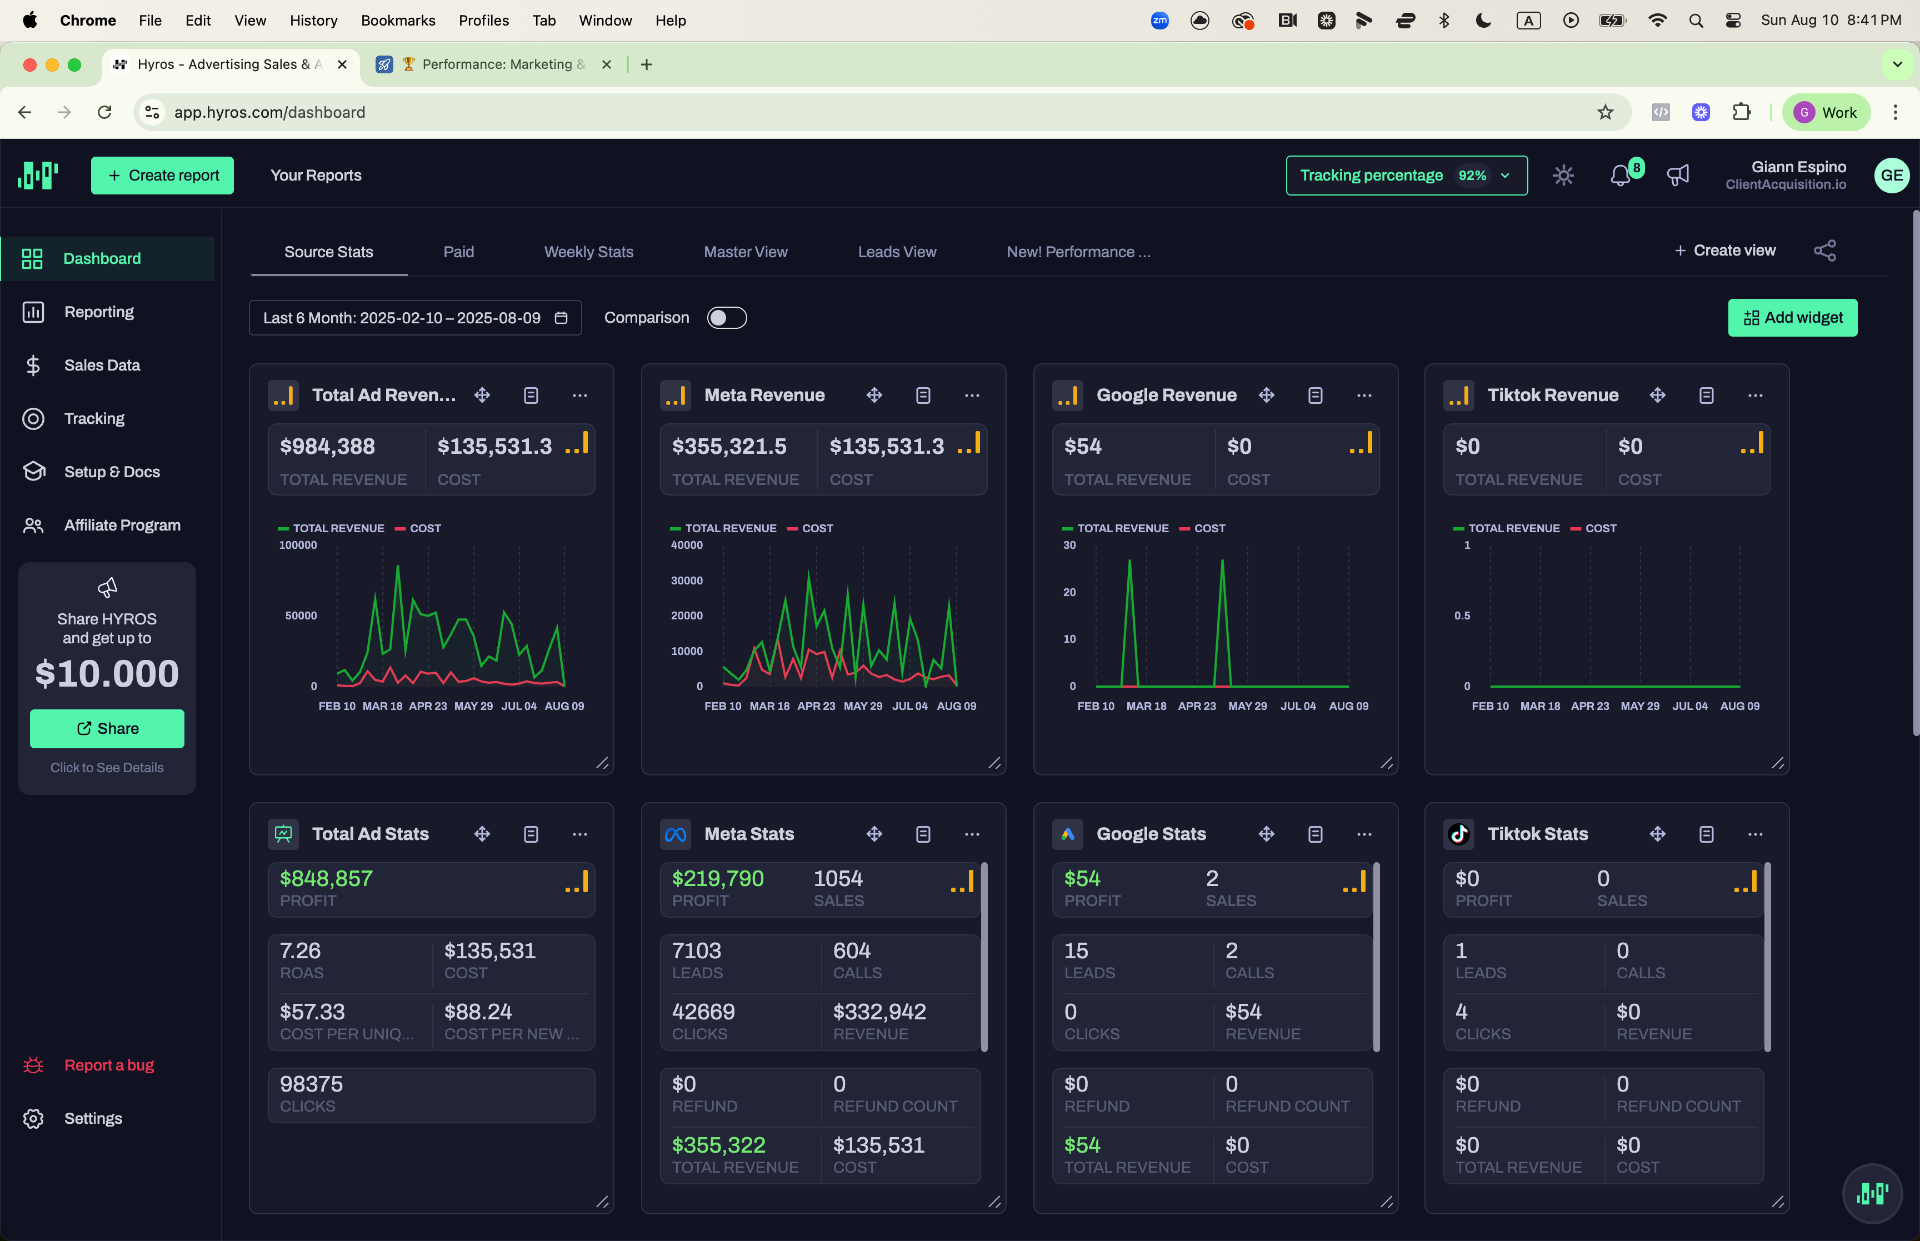
Hyros — 6-Month Source Stats: $984K Revenue
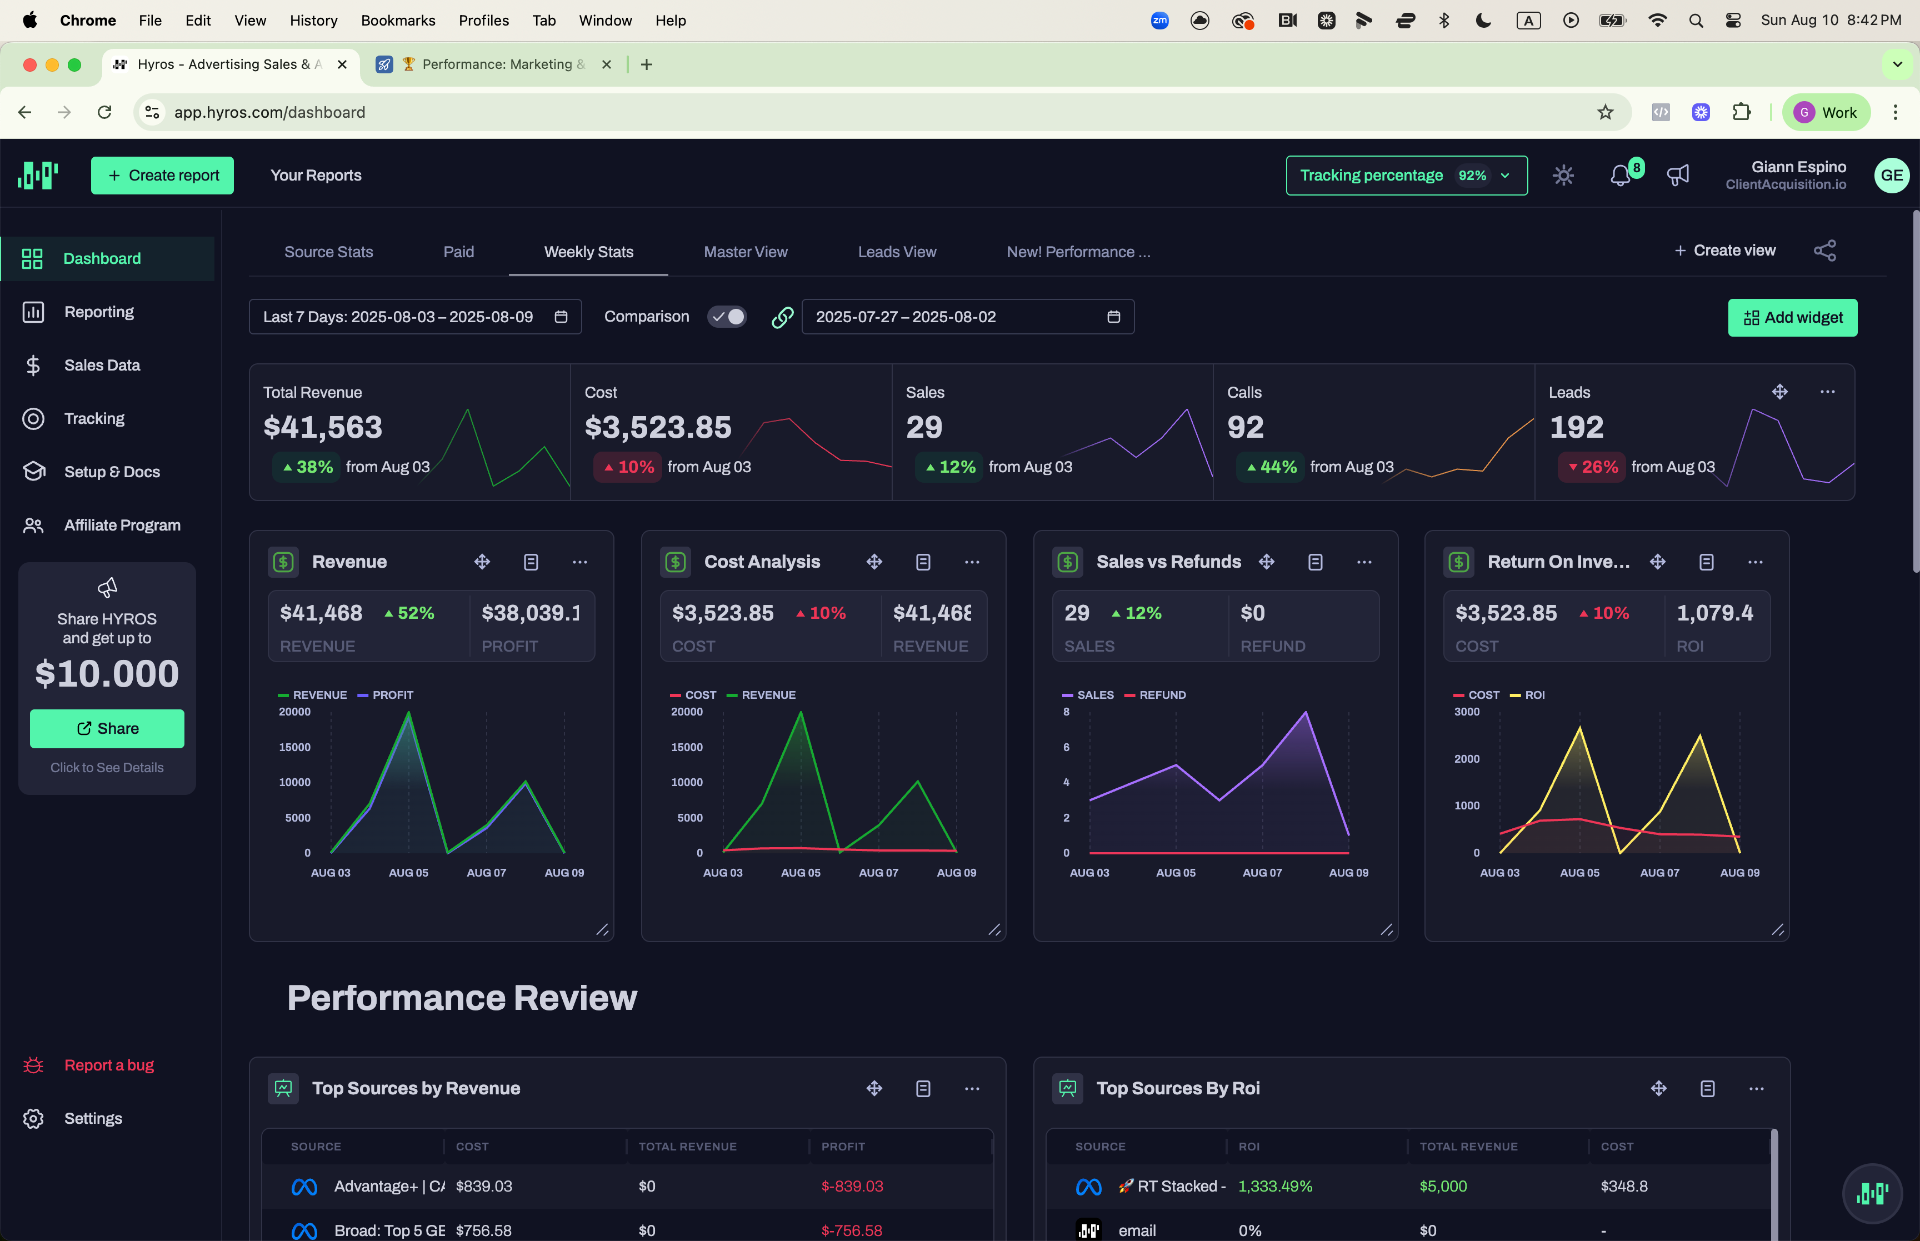
Hyros — Weekly Stats: $41K Revenue, 29 Sales
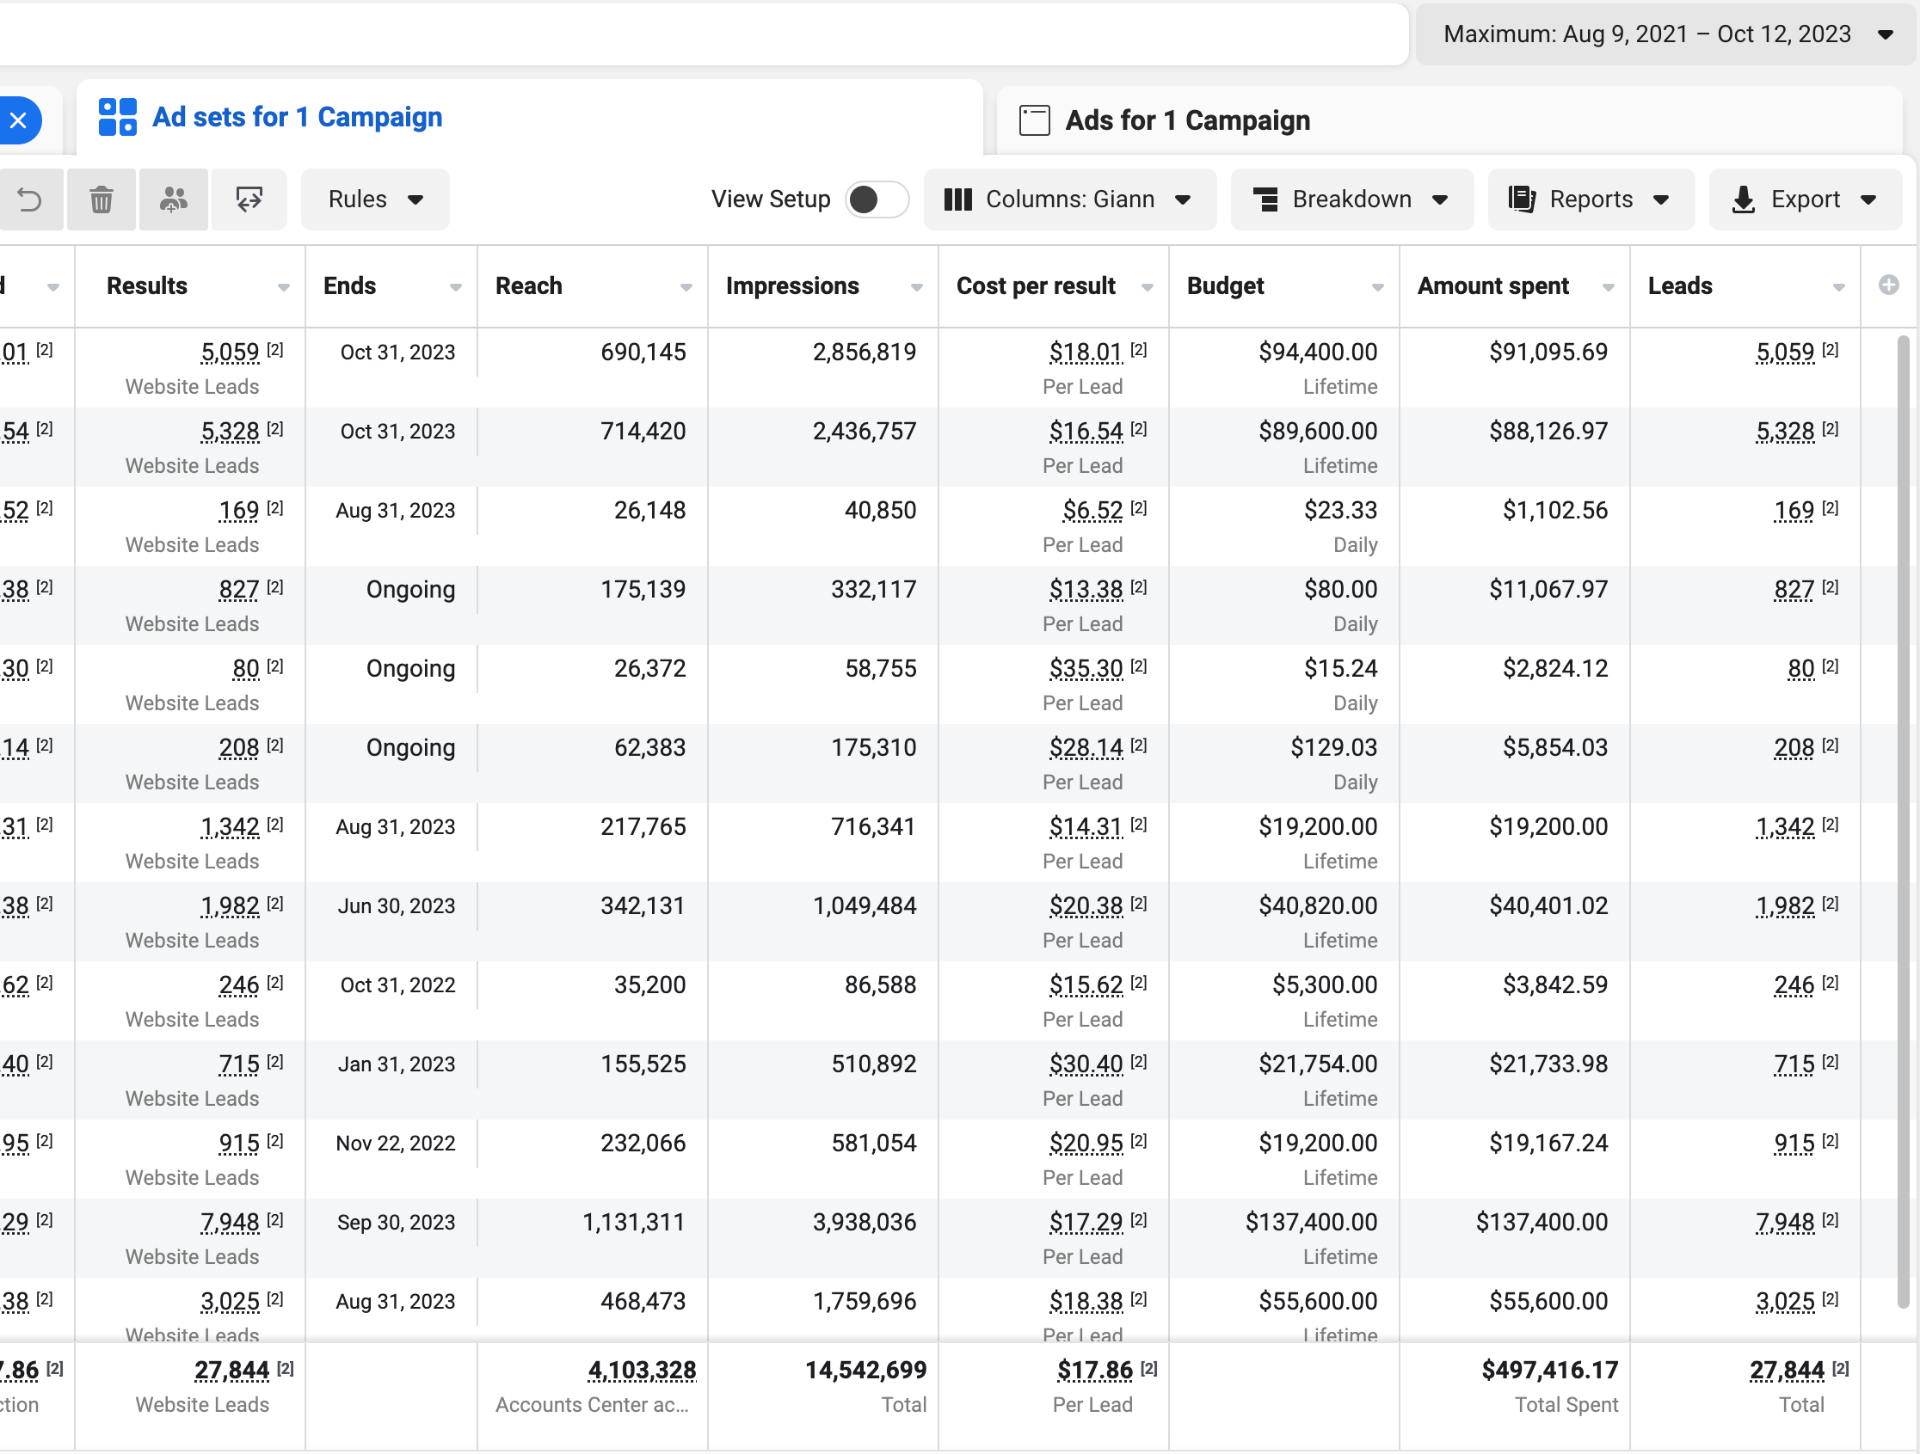
$497K Spent → 27,844 Leads (Detailed View)
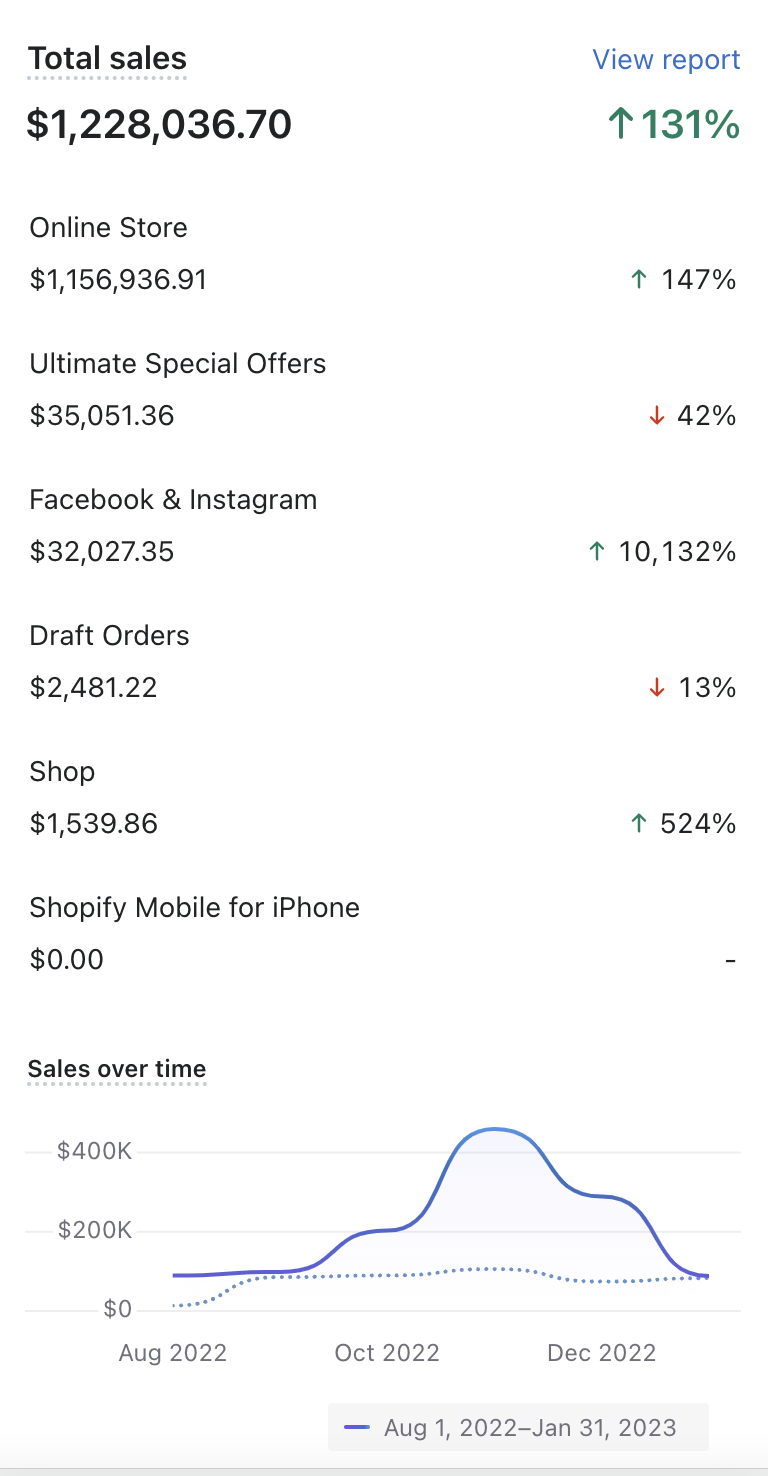
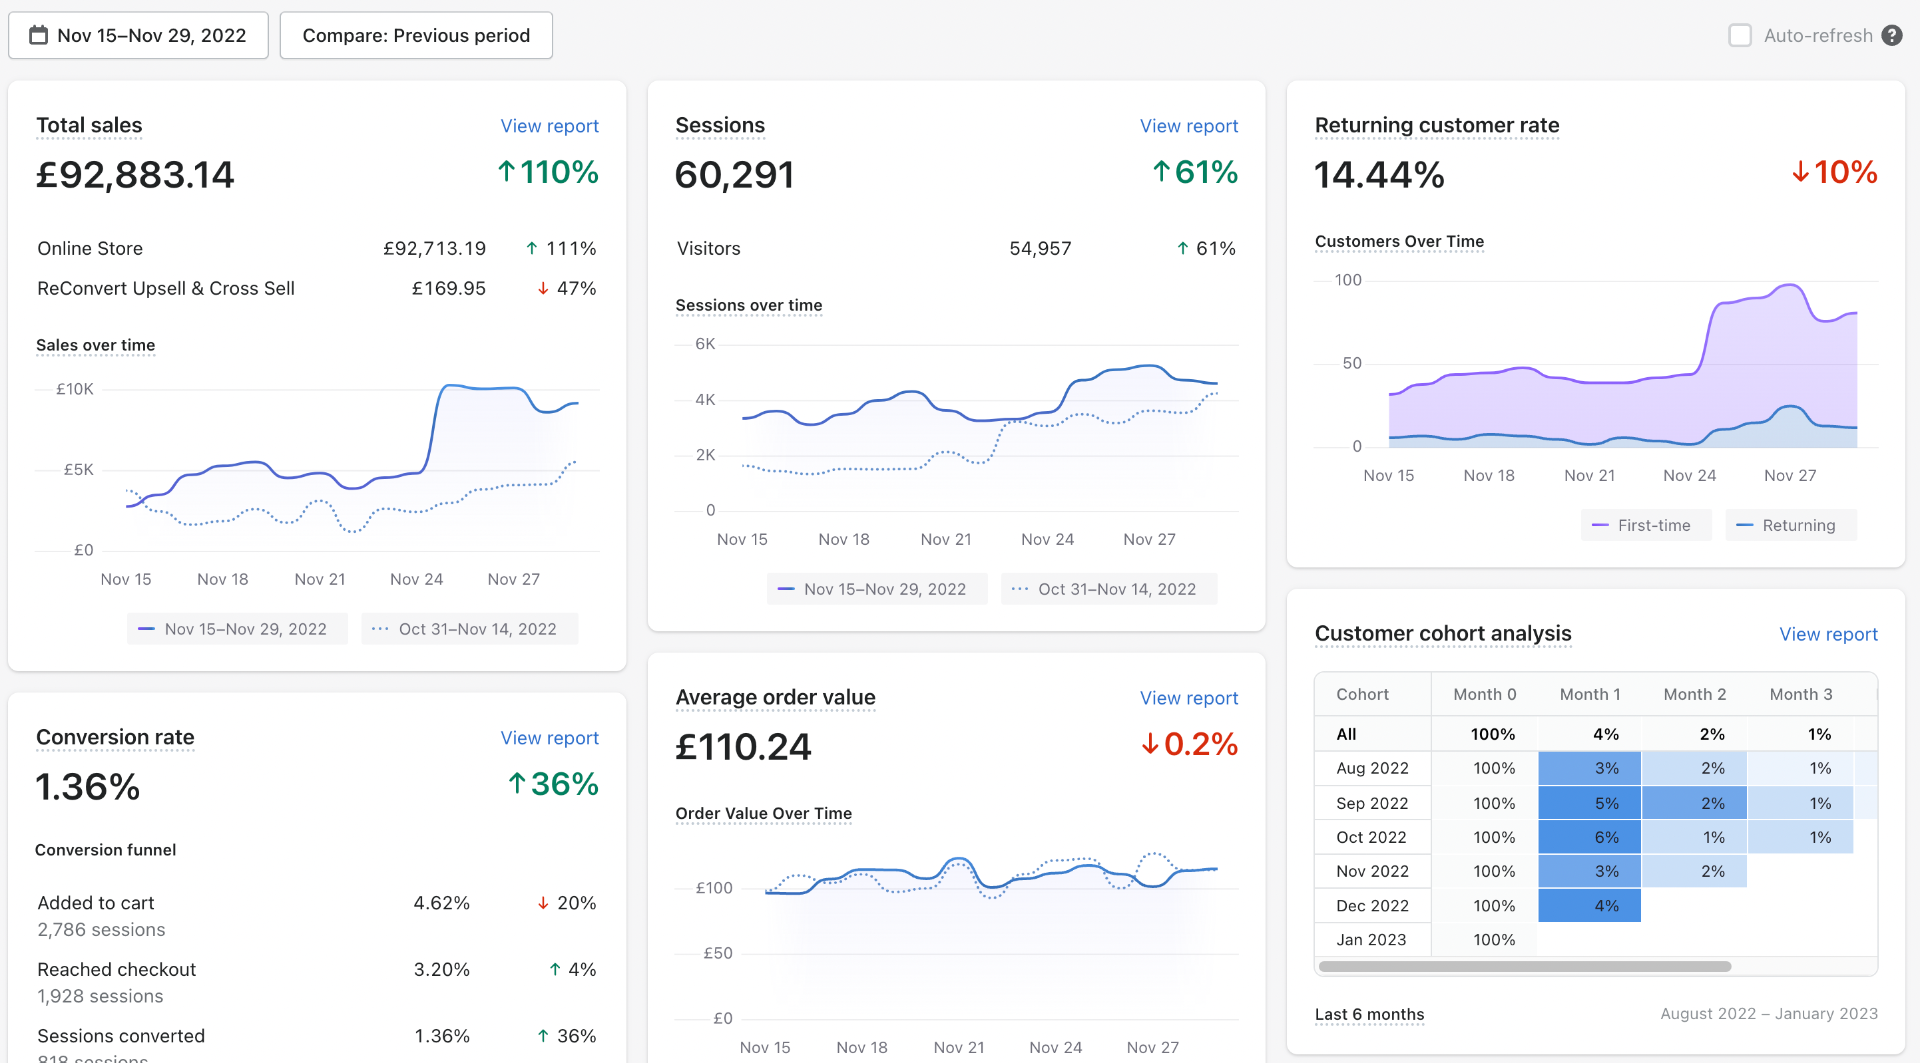
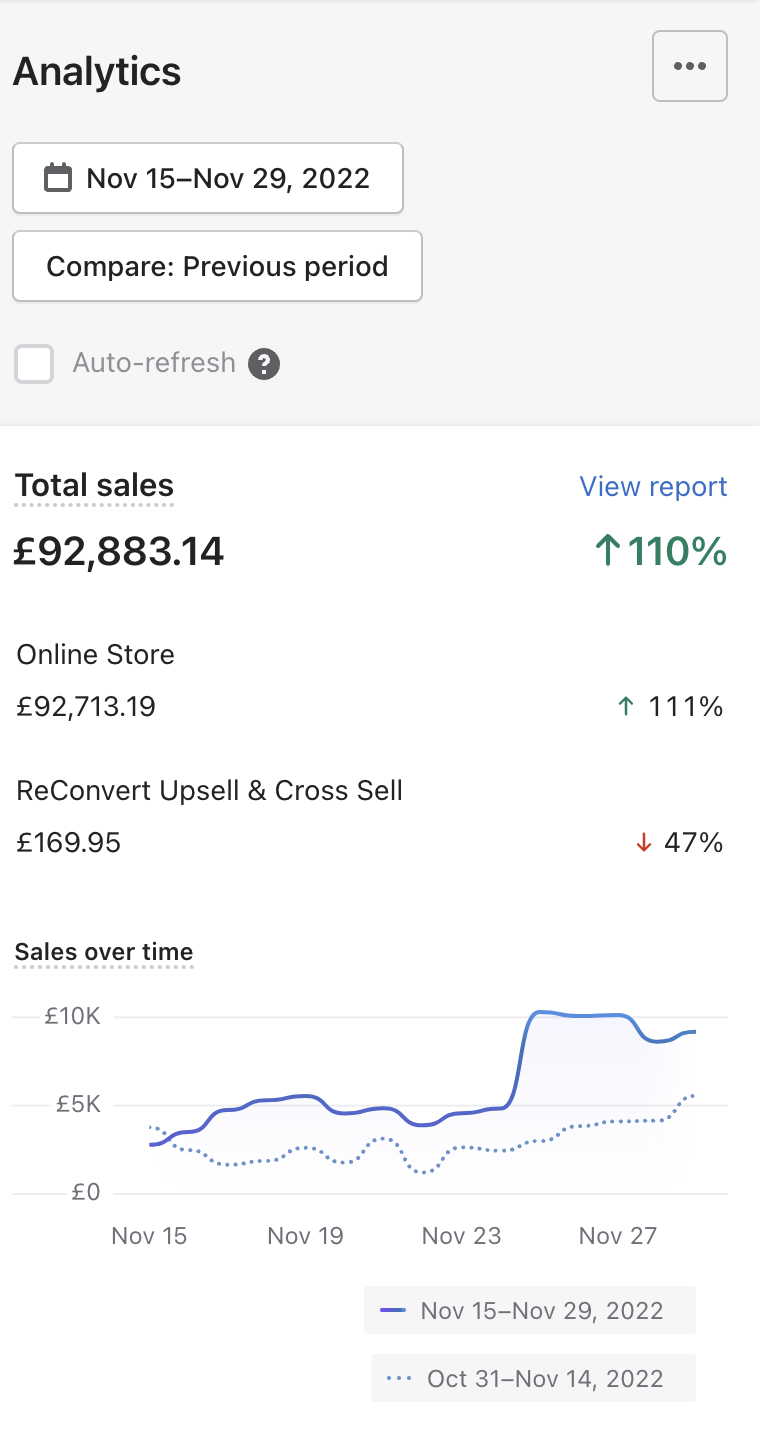
$1.22M in 6 Months — ↑131% (Aug 2022 – Jan 2023)
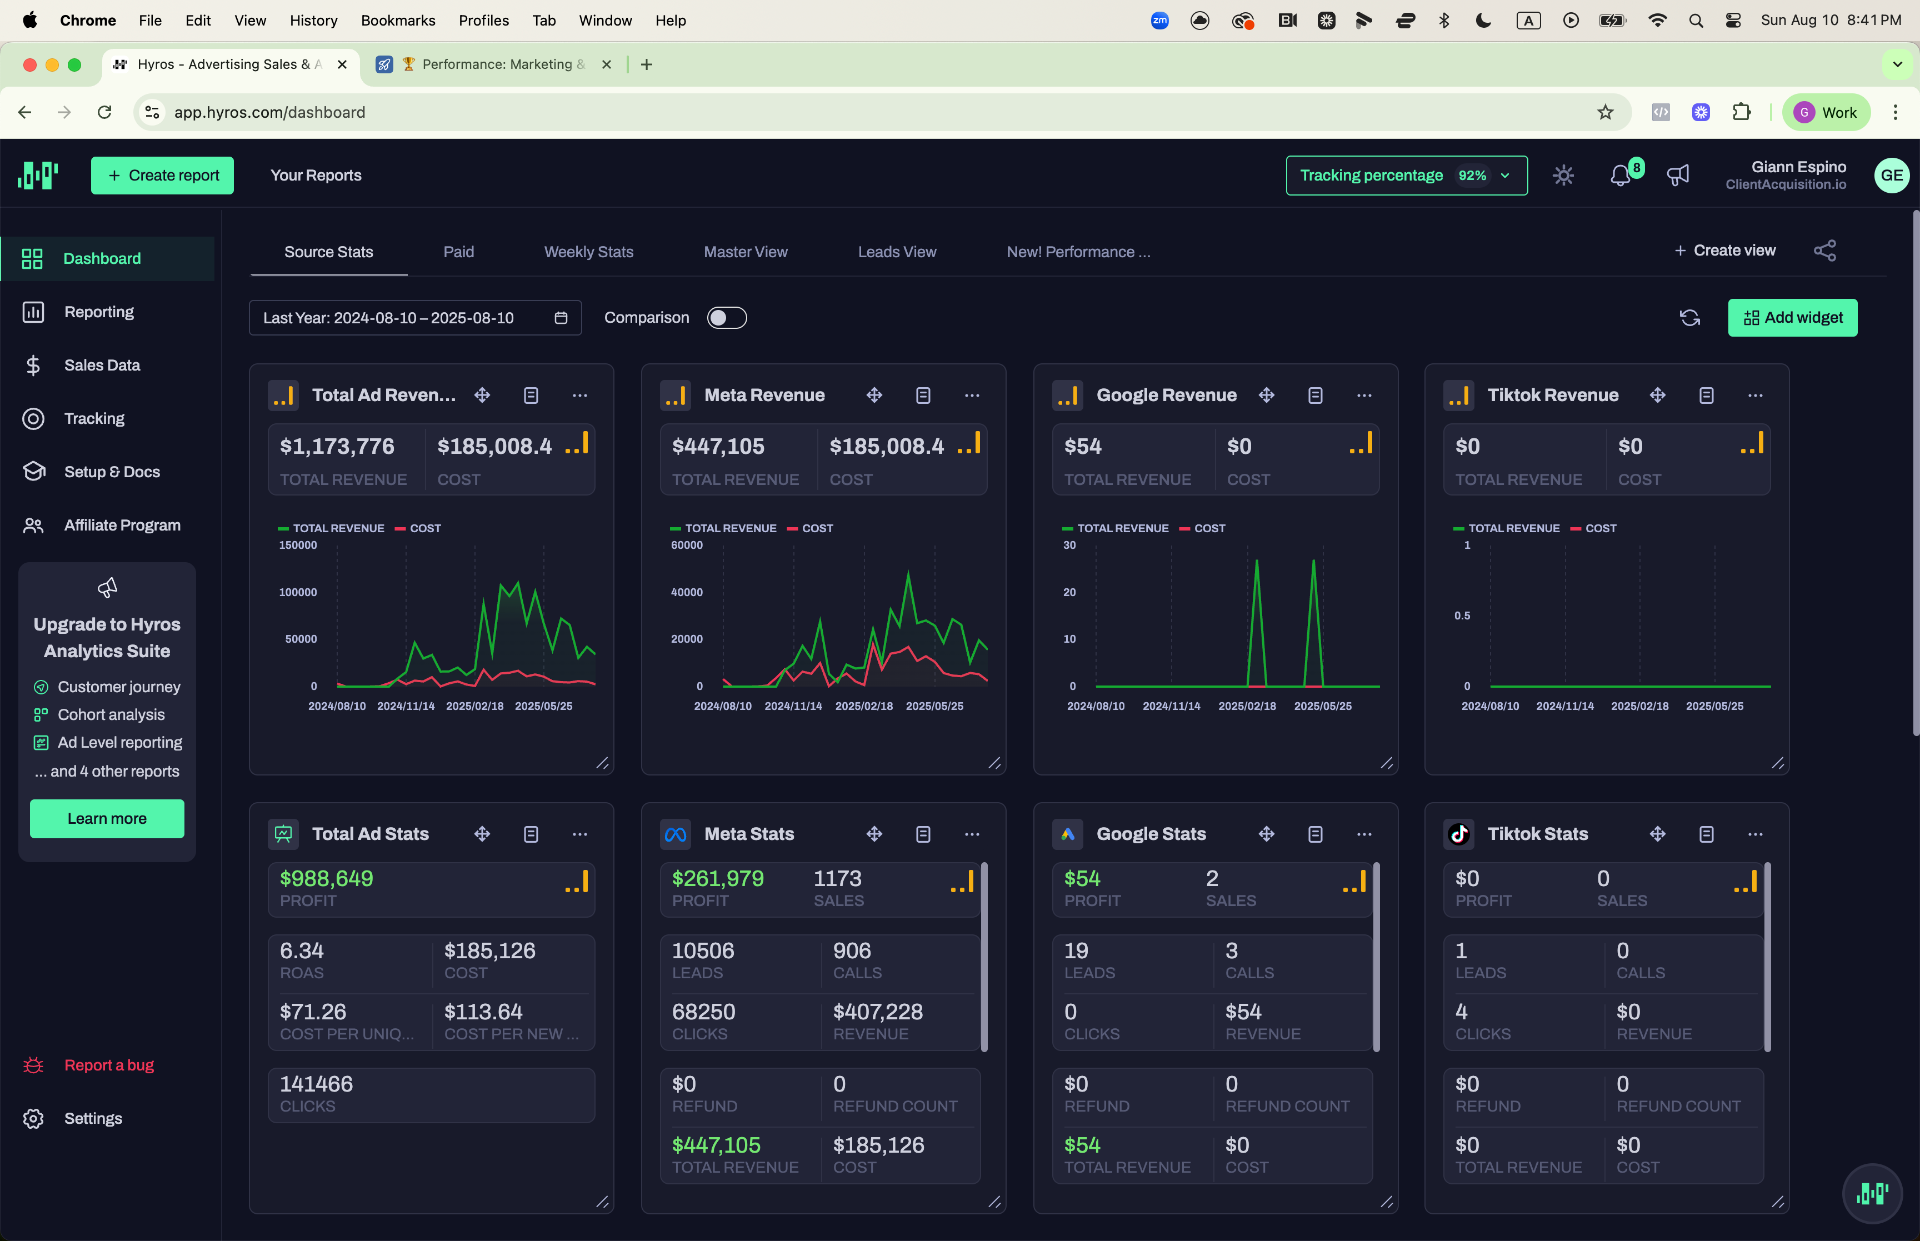
Hyros — 12-Month Source Stats: $1.17M Revenue
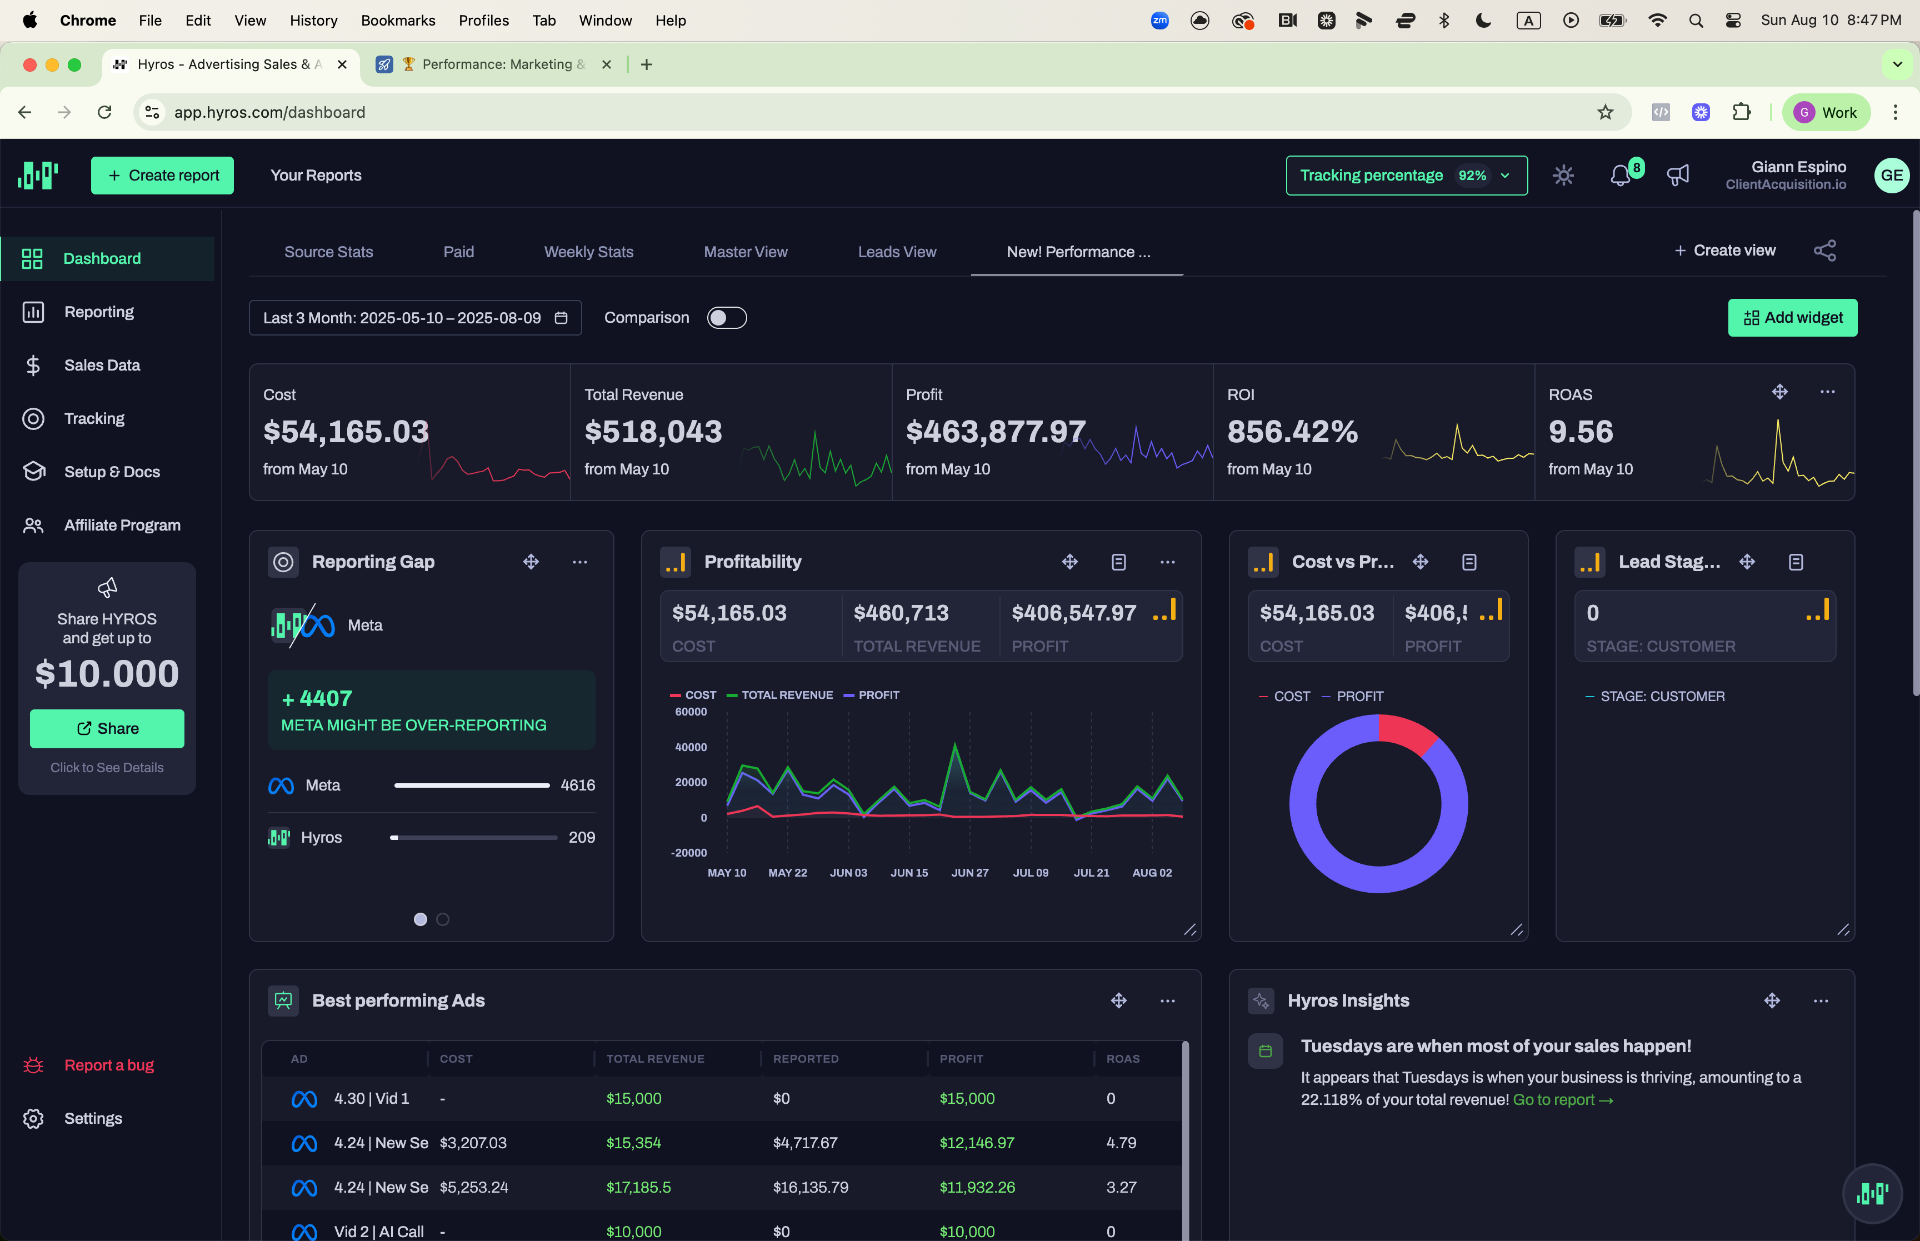
Hyros — 3-Month Performance: 9.56 ROAS, $463K Profit

Hyros — 7-Day Source Stats (Alt View): $41K Revenue
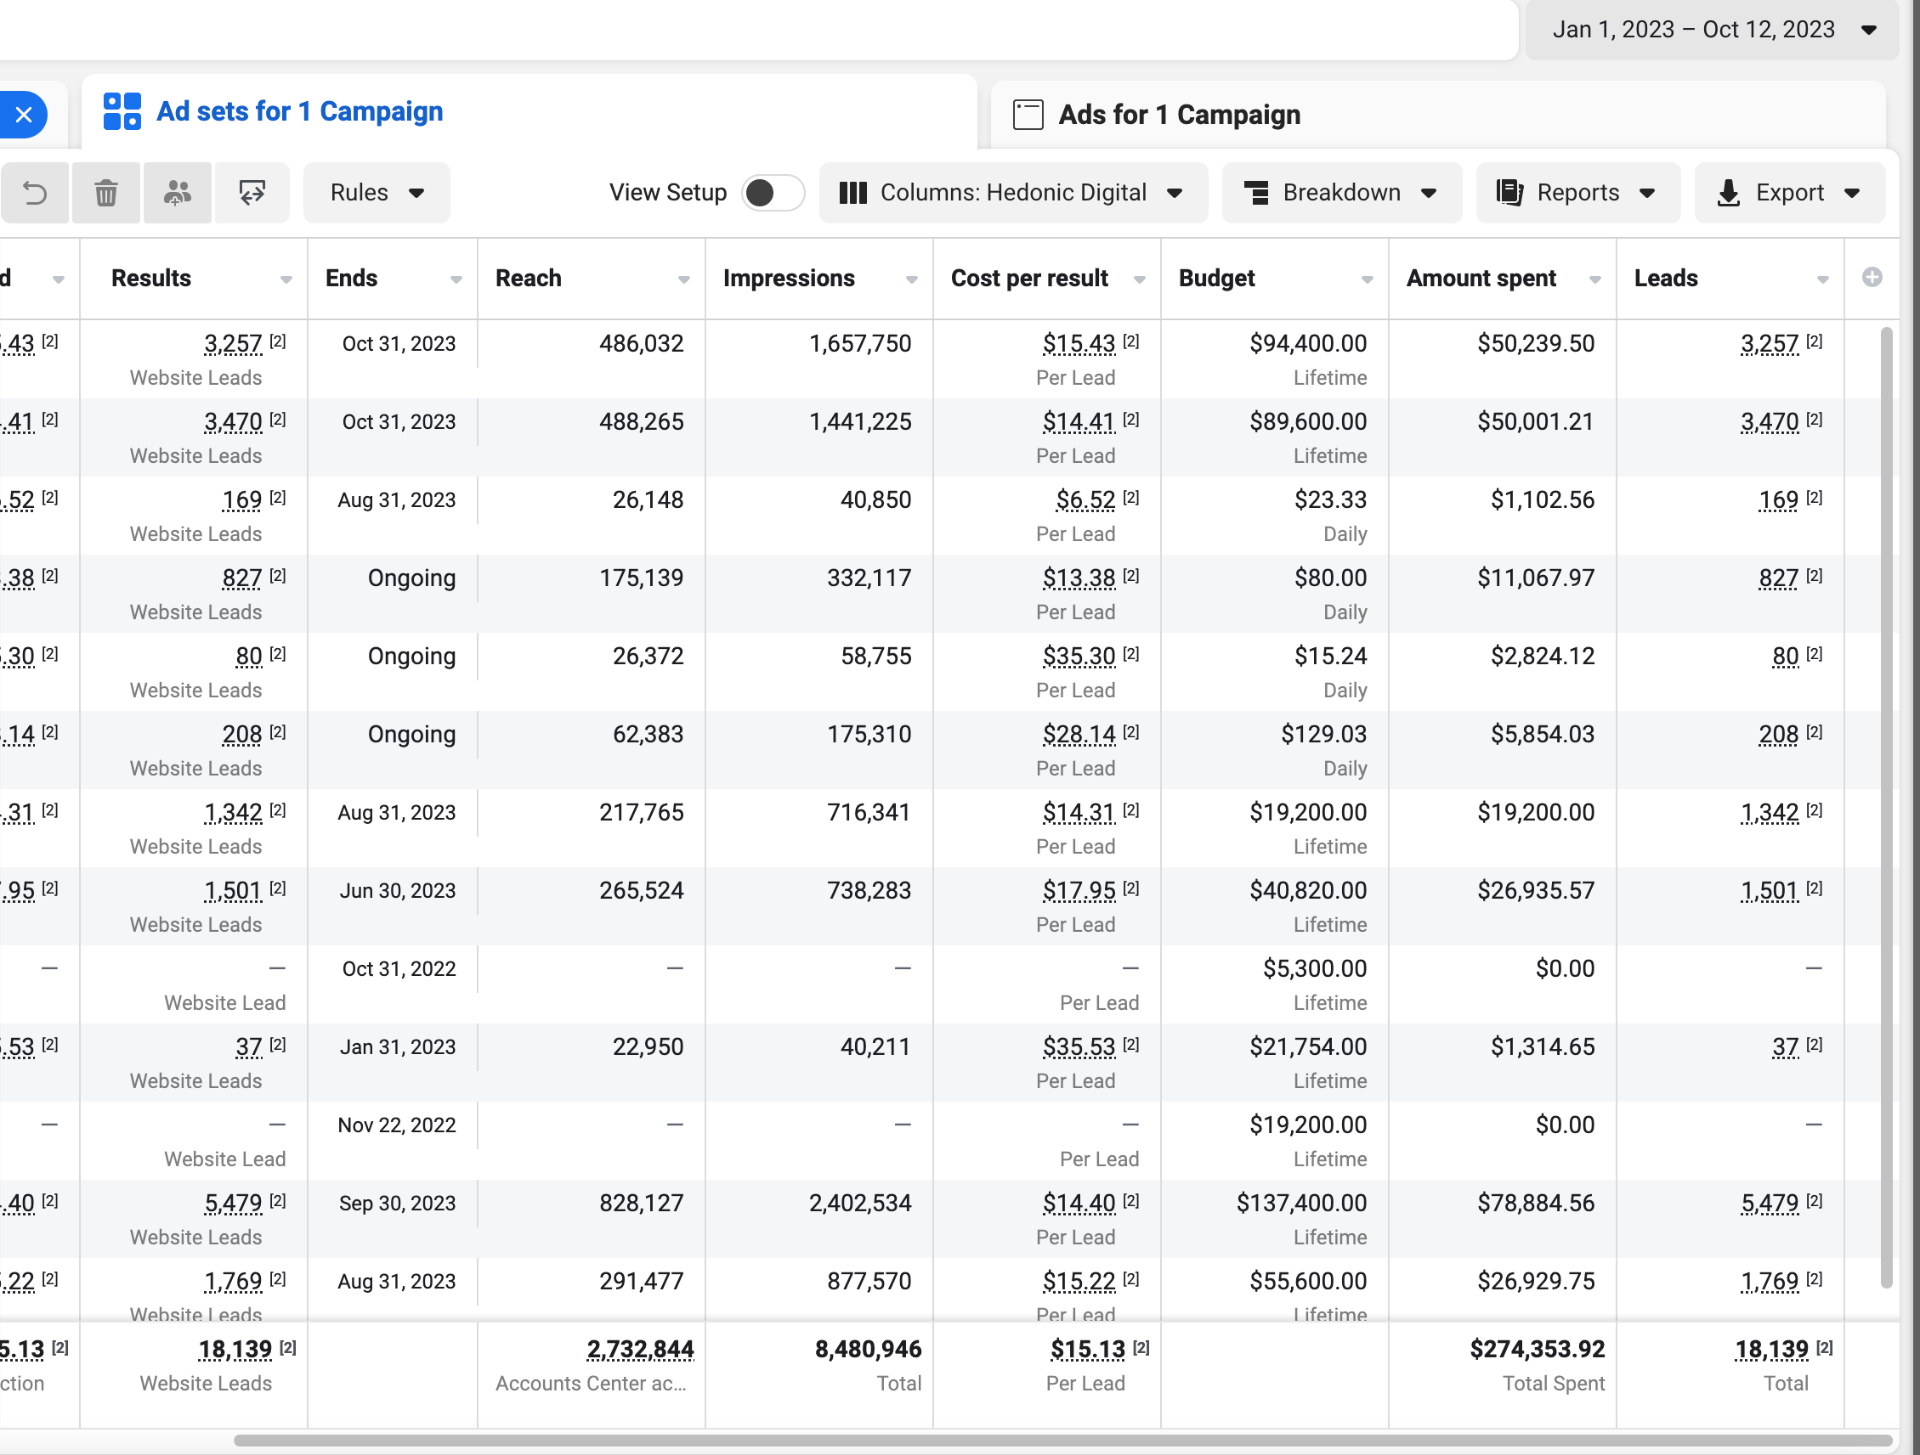
$274K Spent → 18,139 Leads in 2023
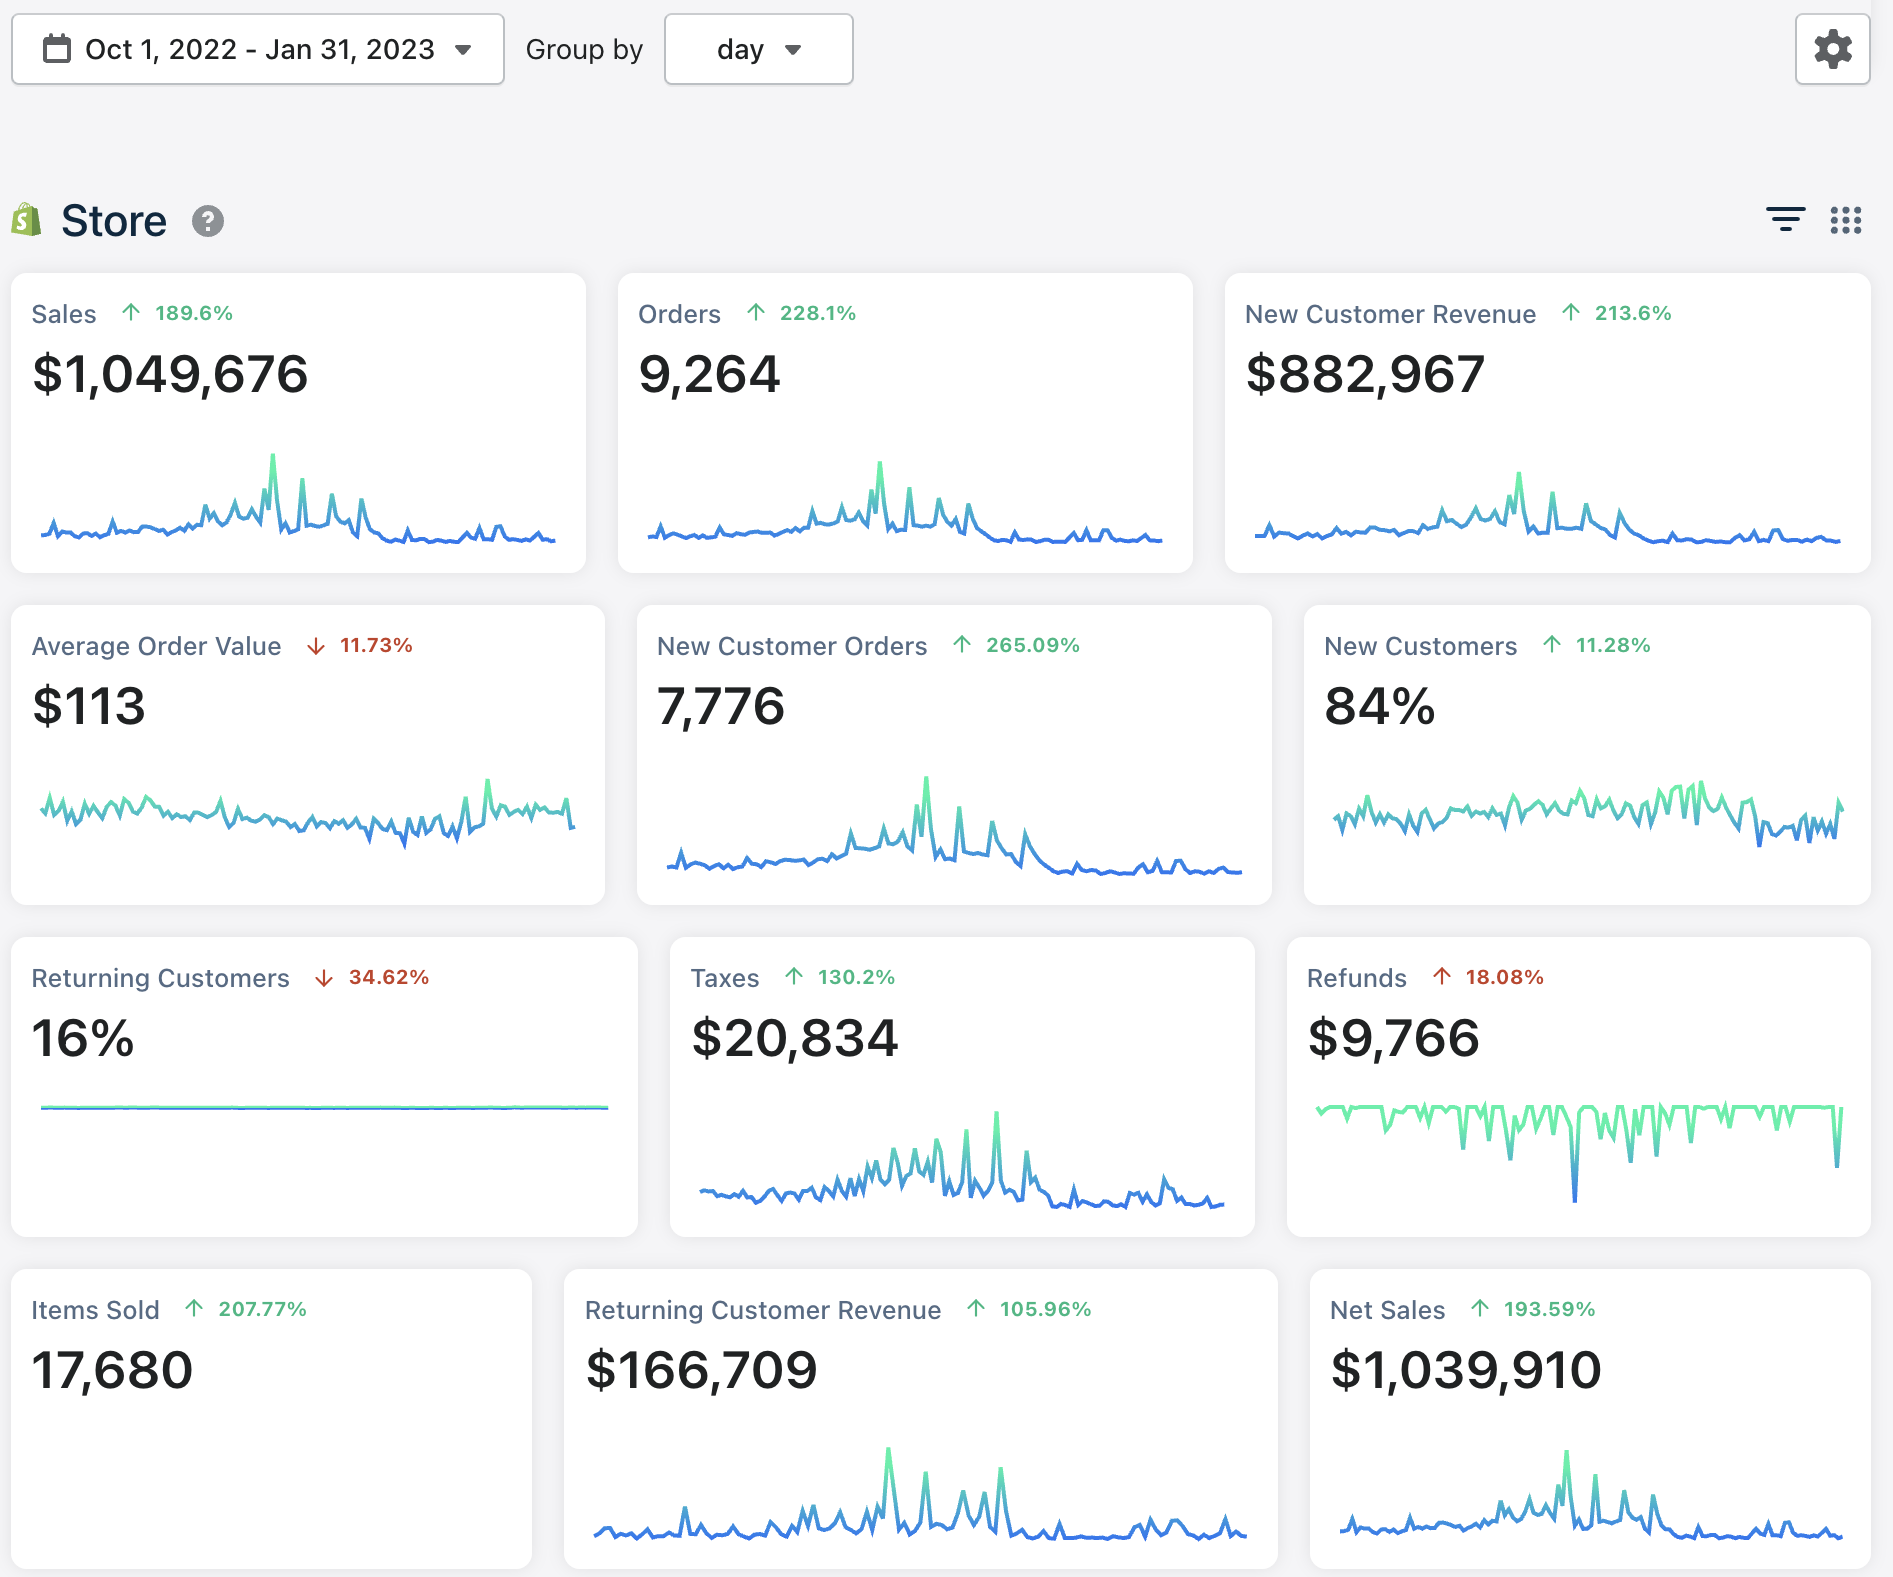
$1.04M in 4 Months — ↑189% (Oct 2022 – Jan 2023)
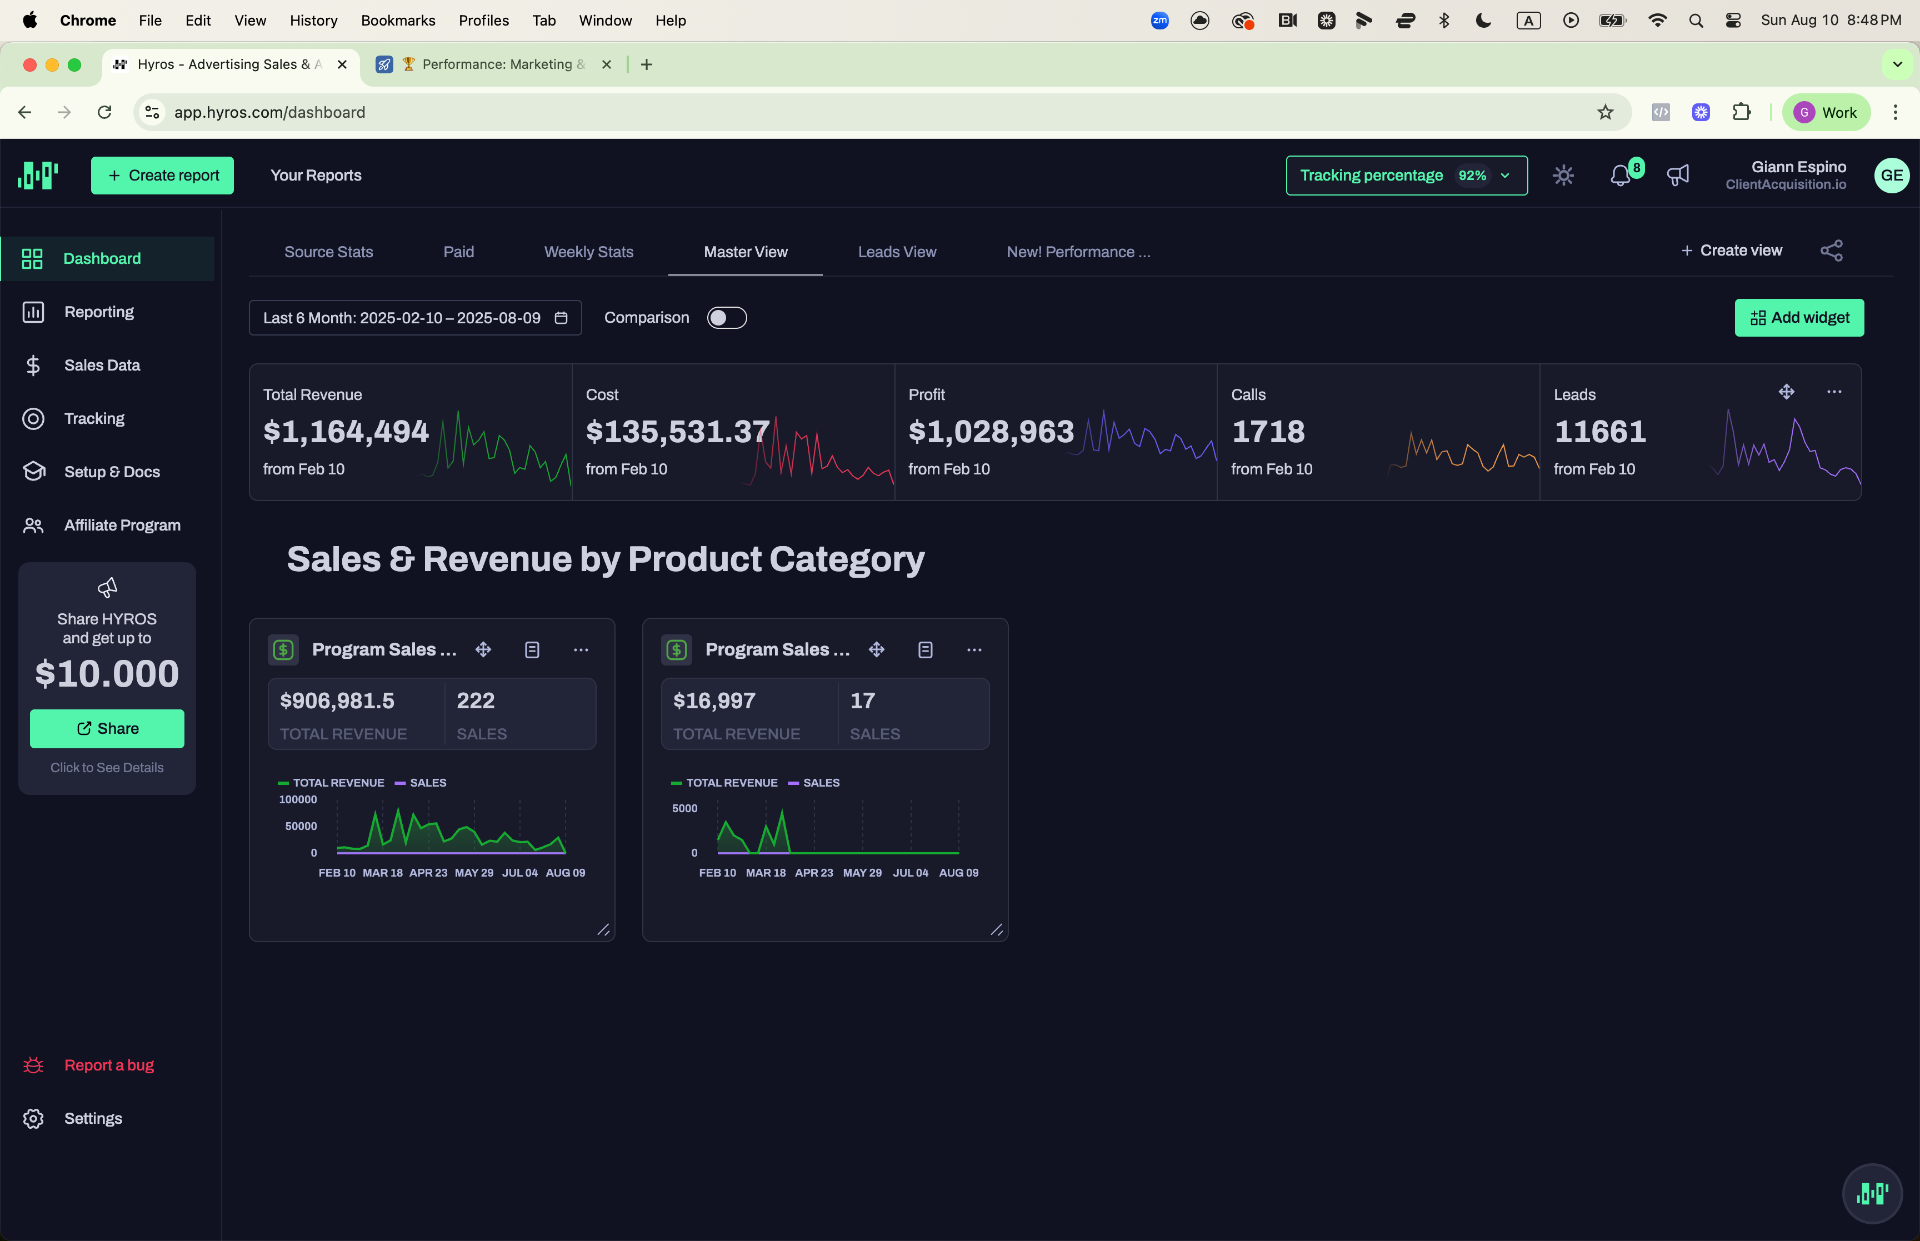
Hyros — 6-Month Master View: $1.16M Revenue, 1,718 Calls
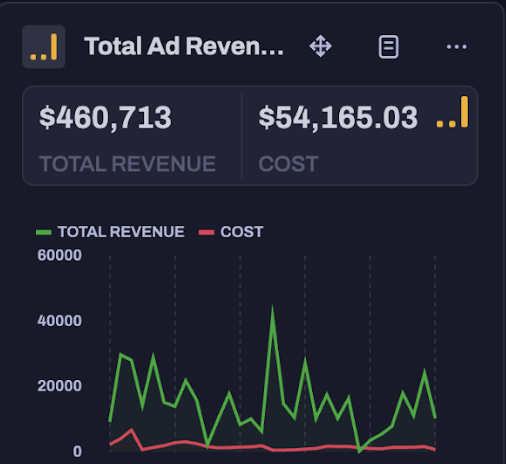
Hyros — $460K Ad Revenue vs $54K Cost
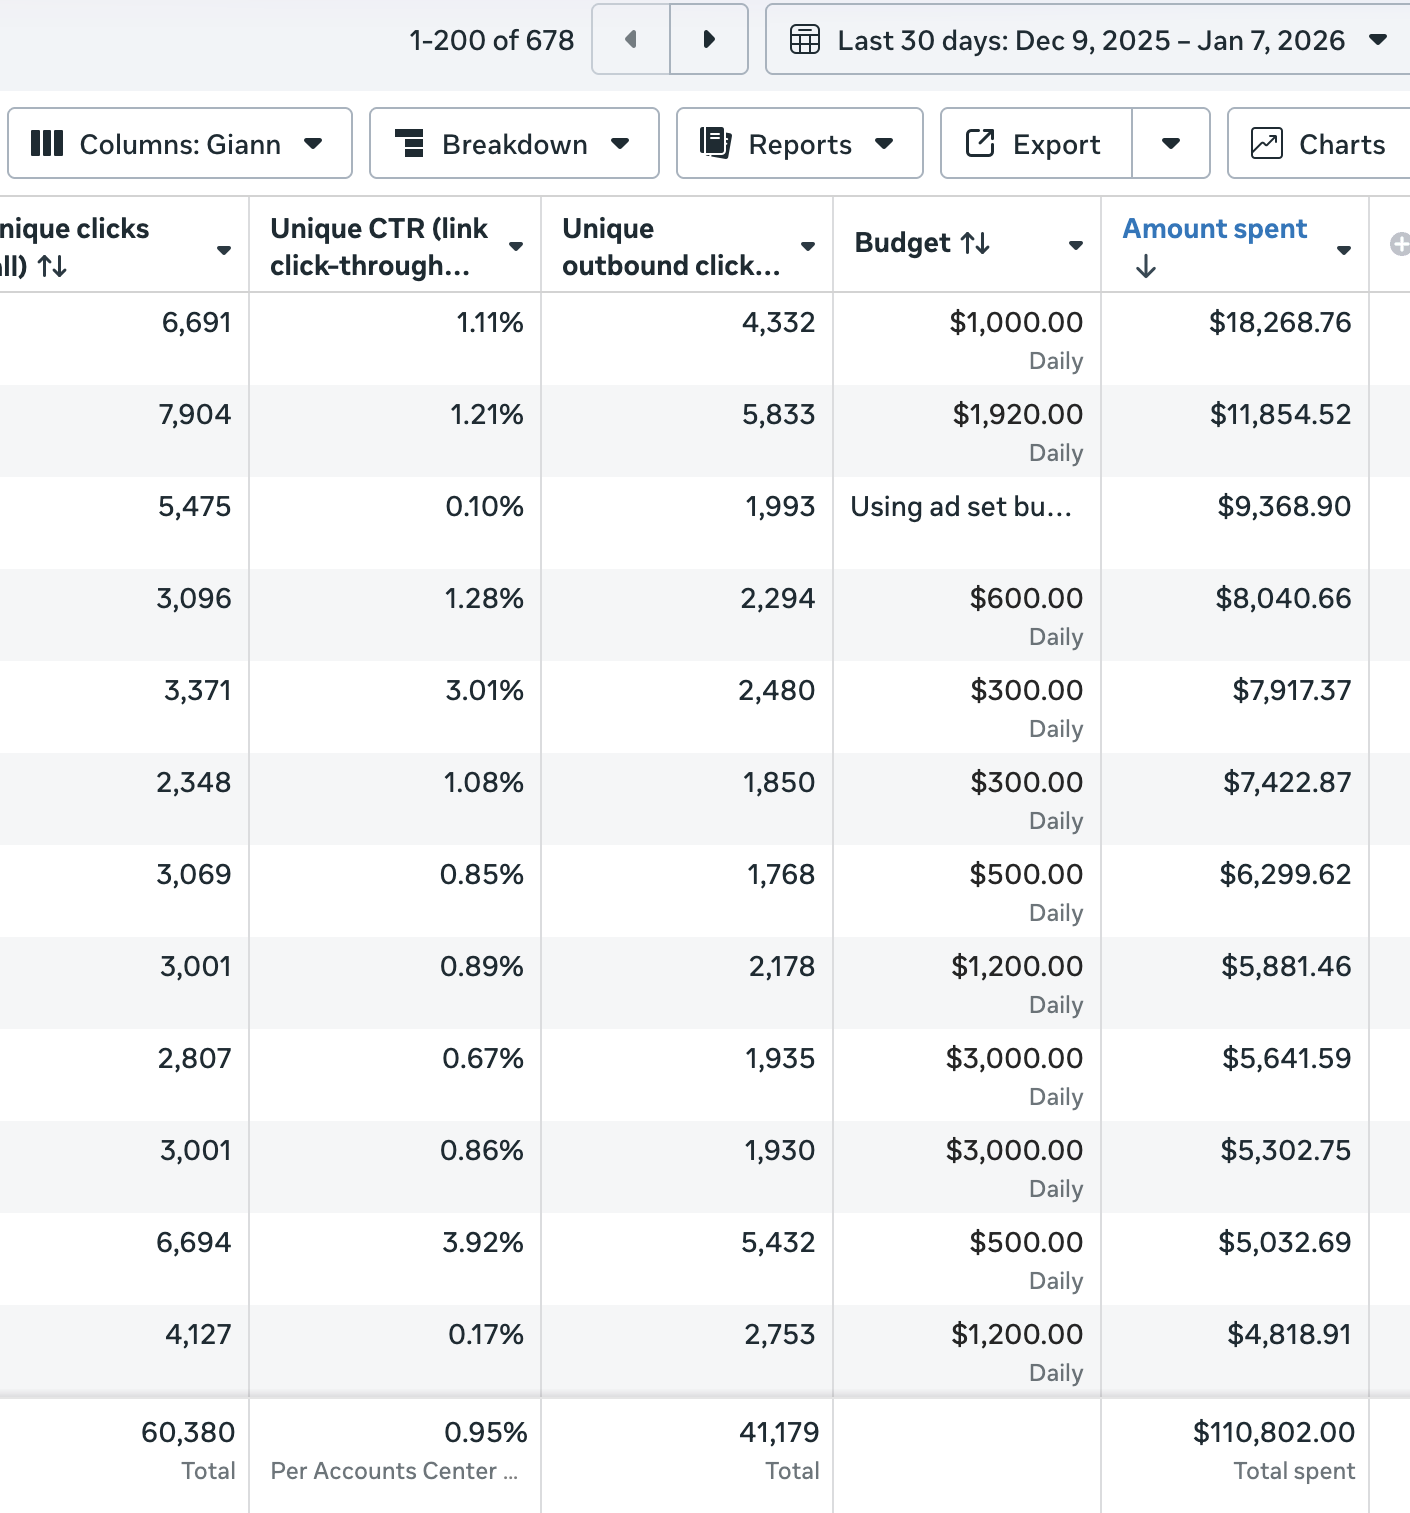
$110K Spent in Last 30 Days
$8.5K Spent → 639 Leads in 30 Days
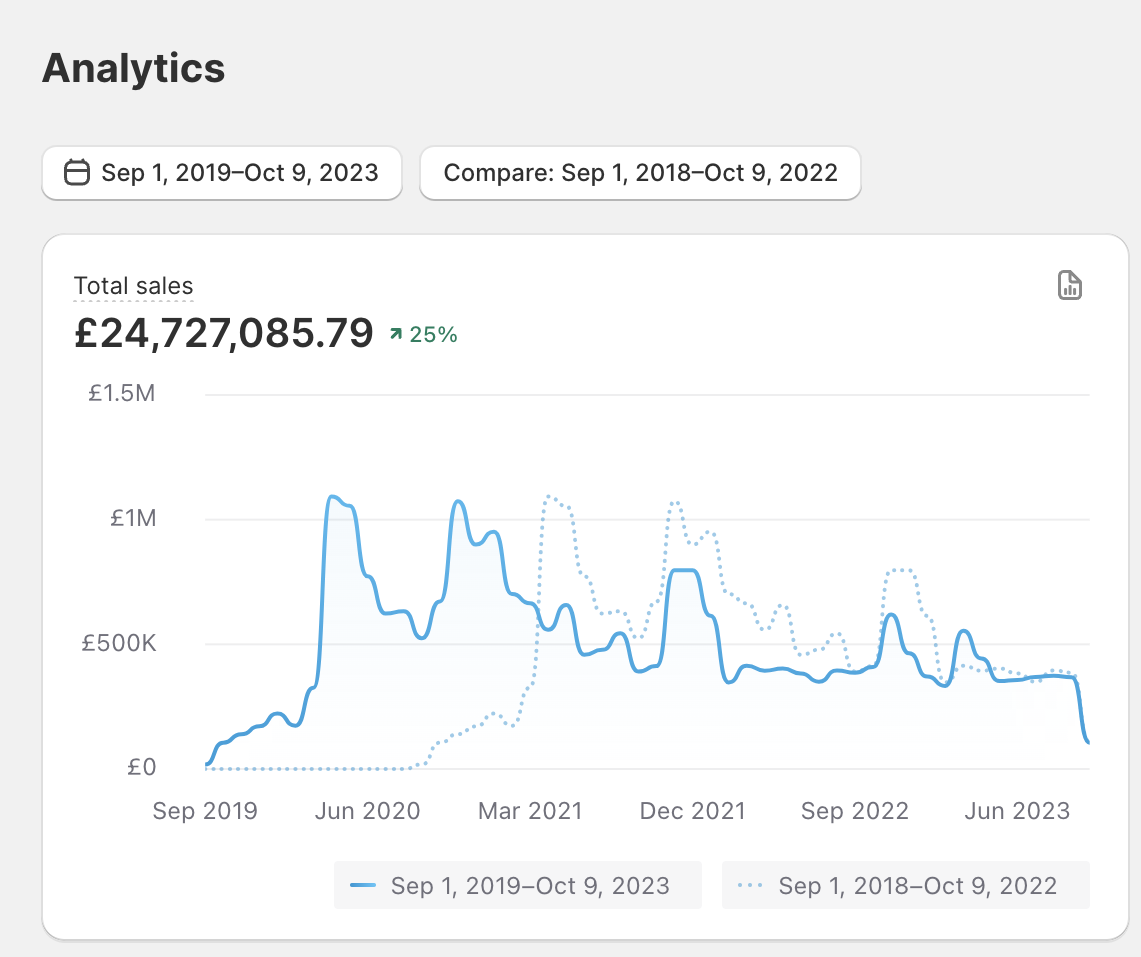
£24.7M Total Sales — Revenue Growth Chart
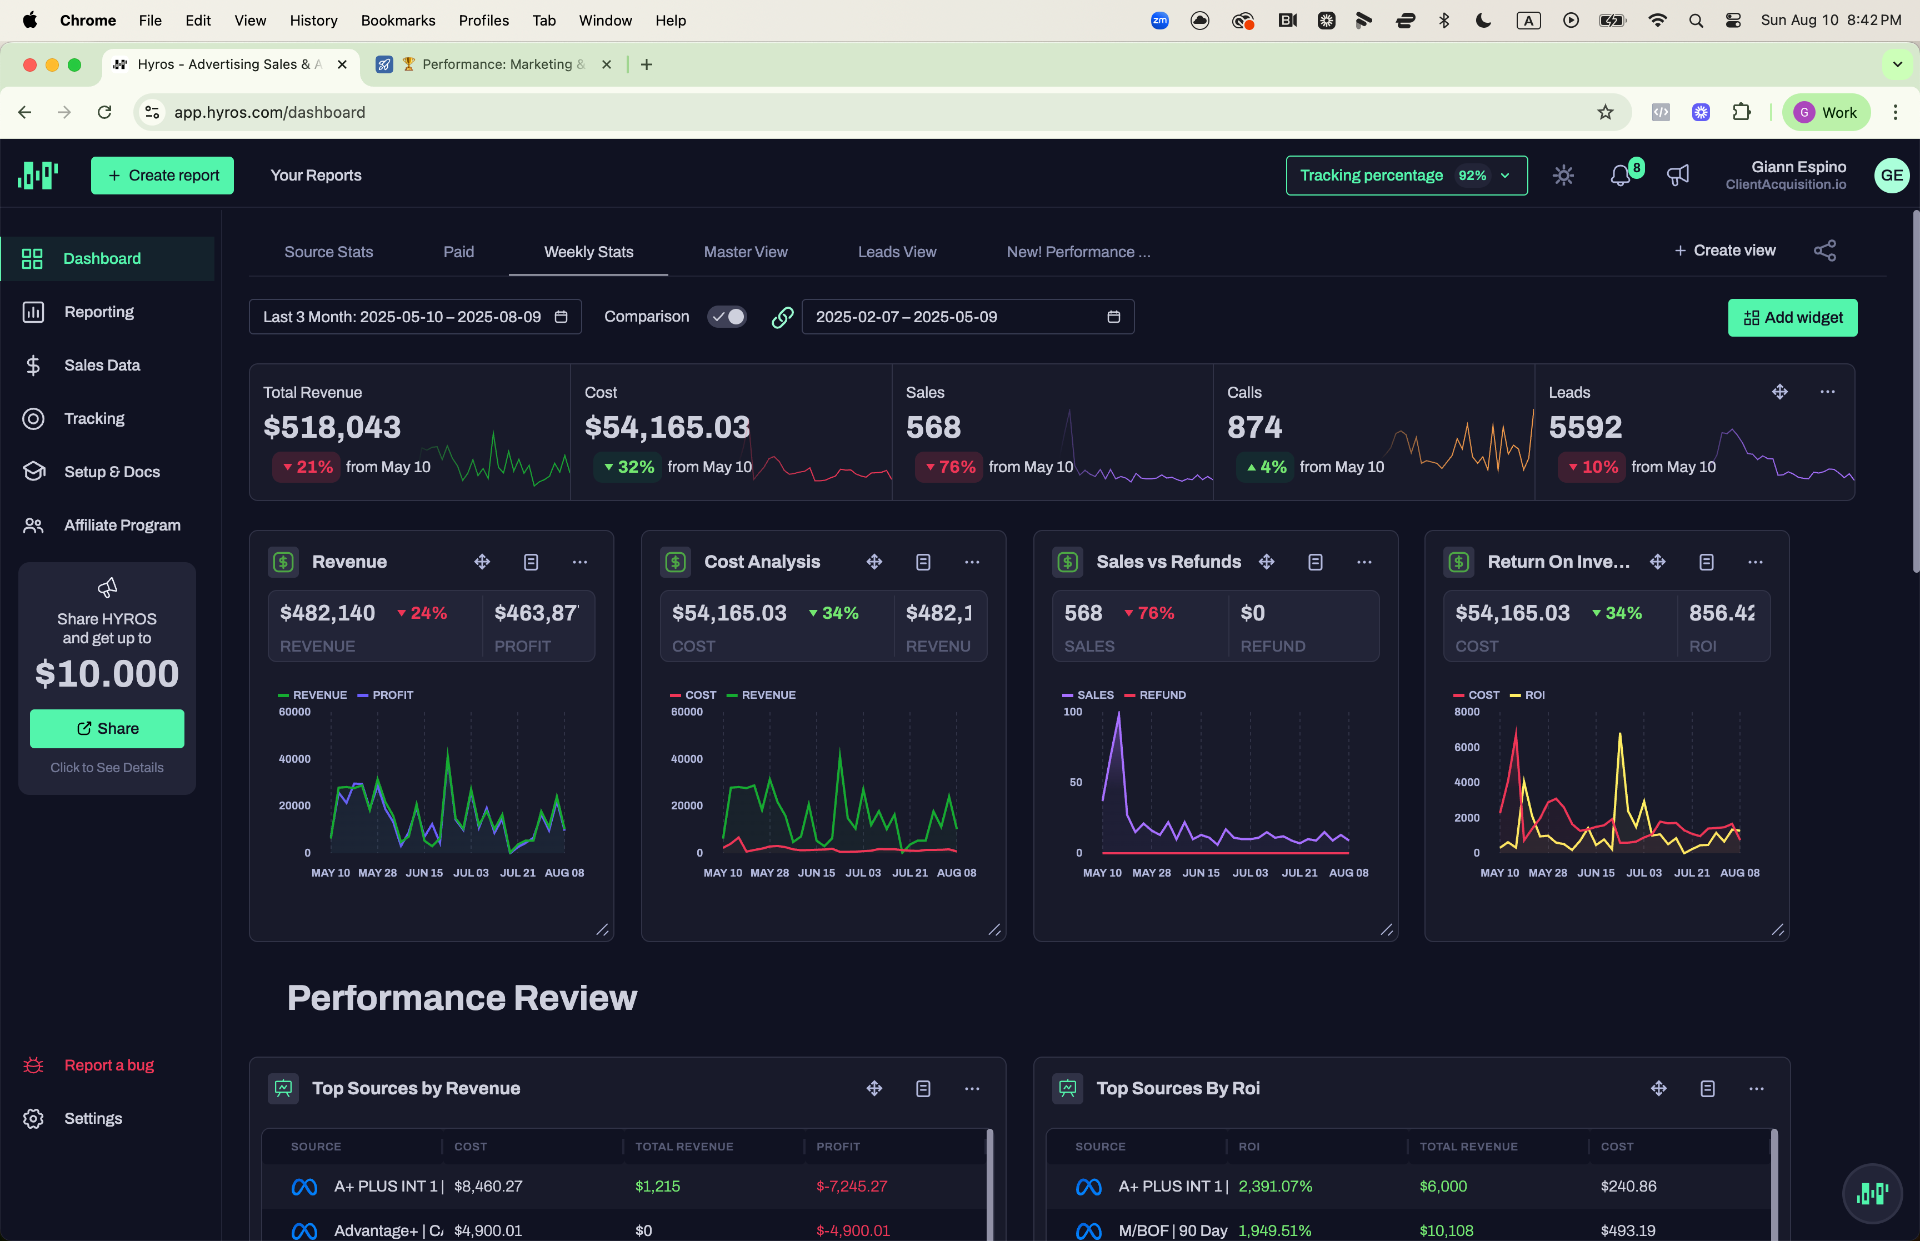
Hyros — 3-Month Weekly Stats: $518K Revenue, 568 Sales
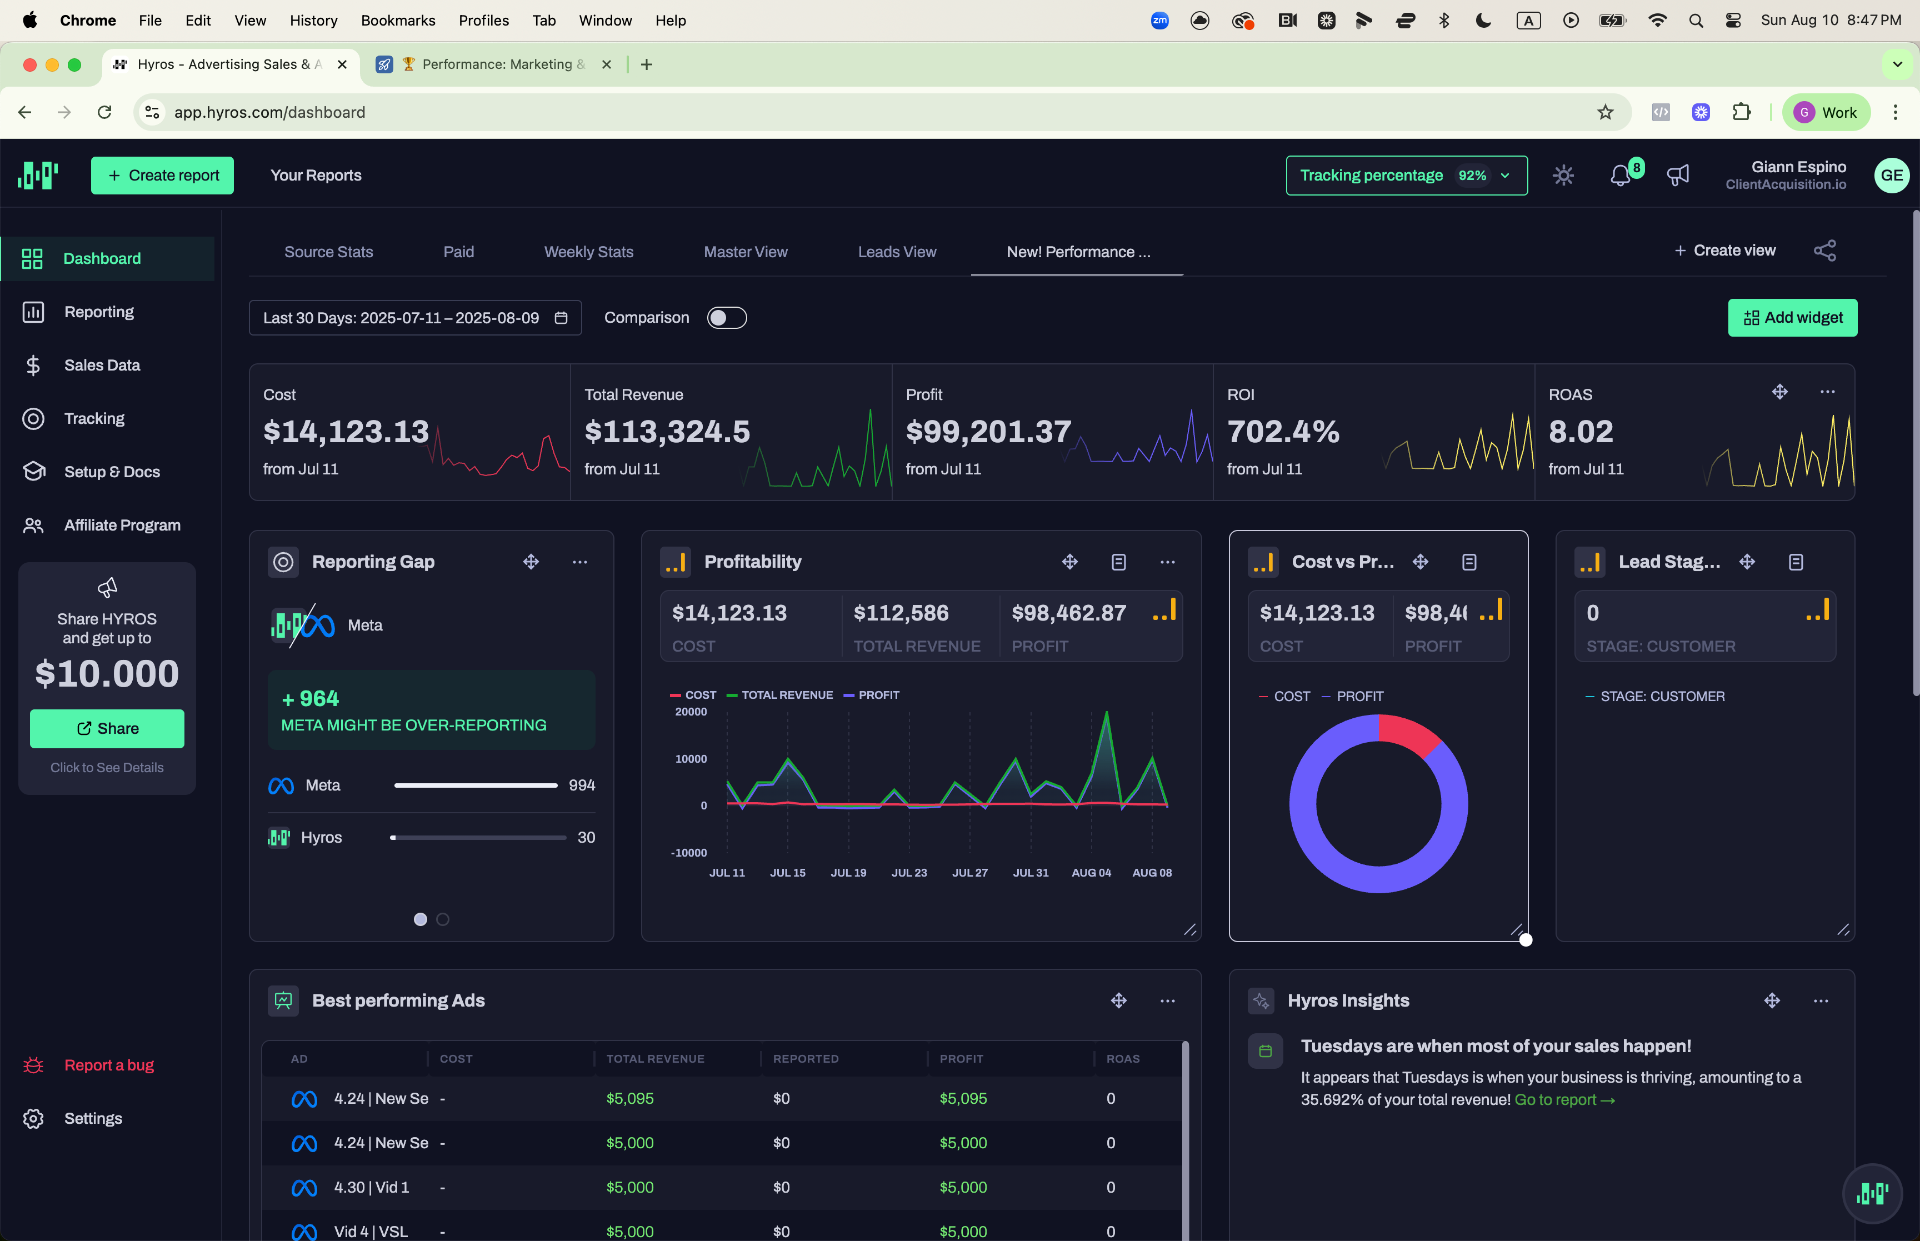
Hyros — 30-Day Performance: 8.02 ROAS, $99K Profit
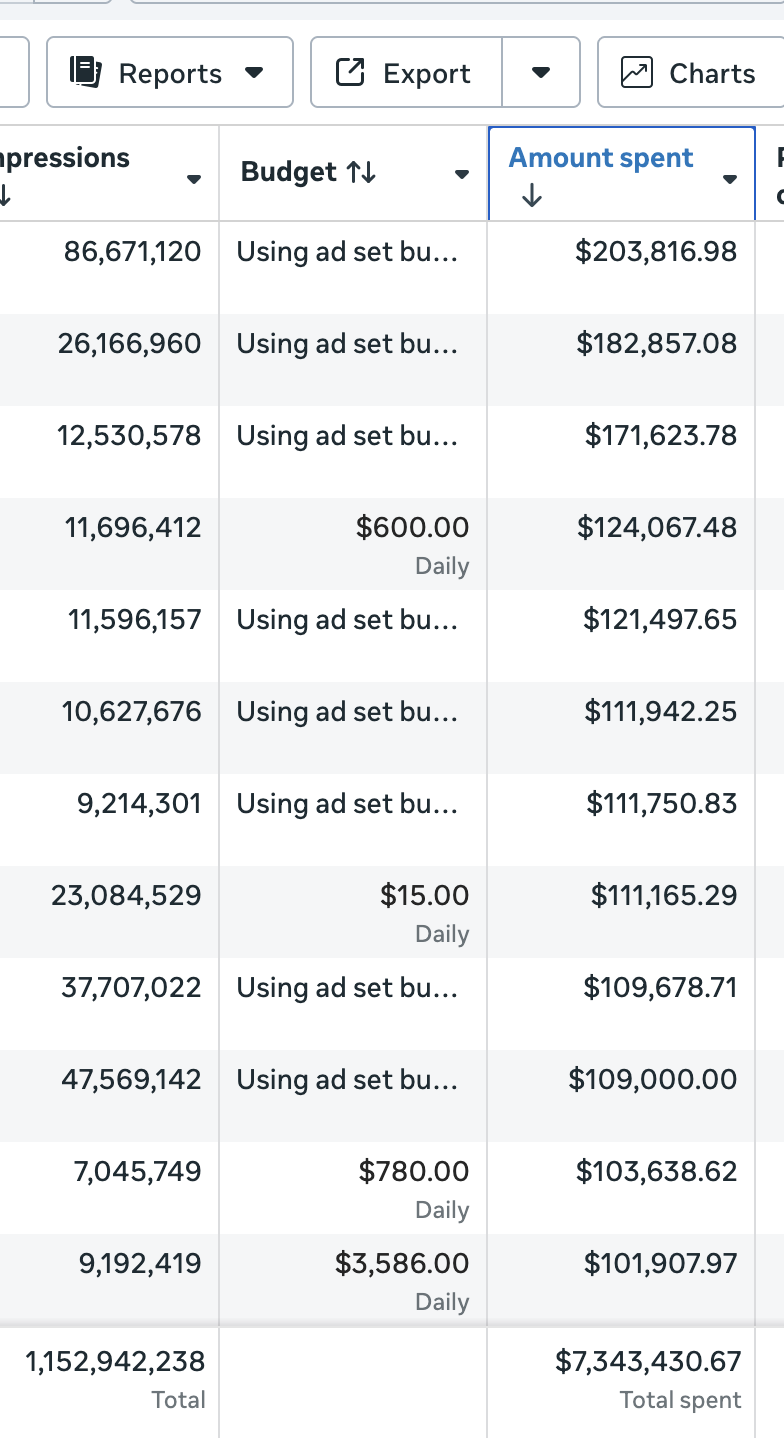
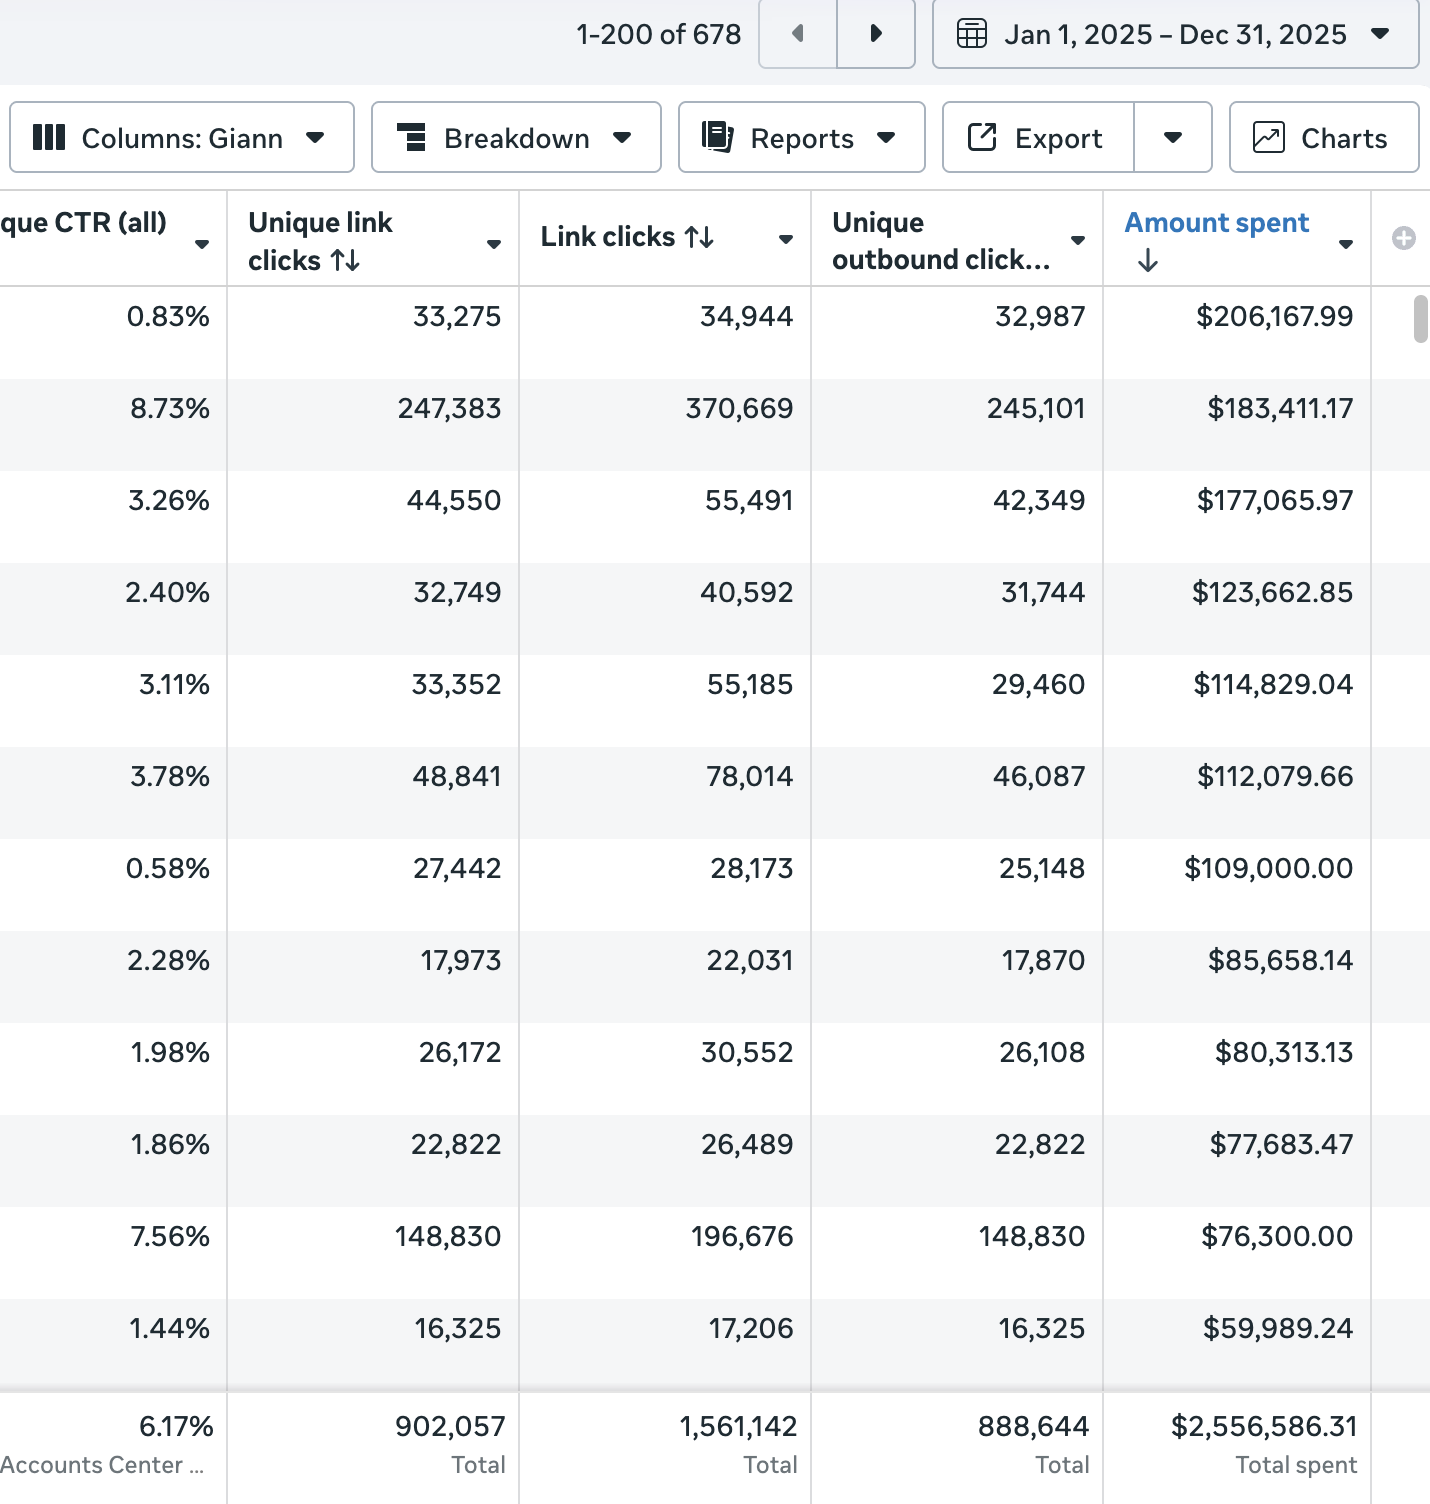
Meta Ads — $7.34M Spent (Sorted by Amount Spent)
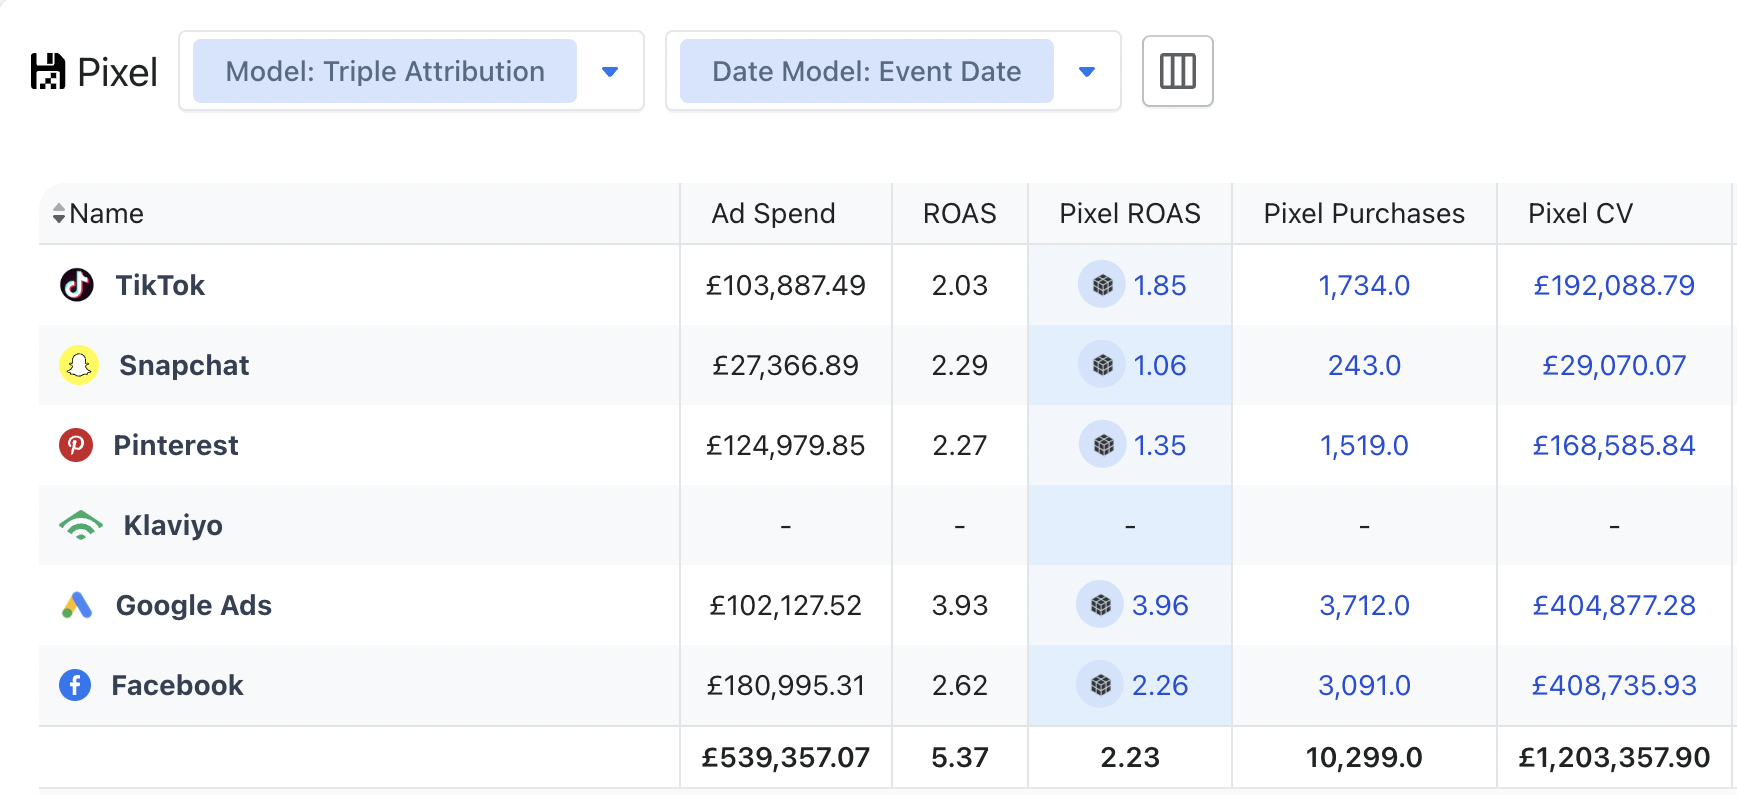
£539K Spent — 5.37x ROAS (6-Channel Pixel Attribution)
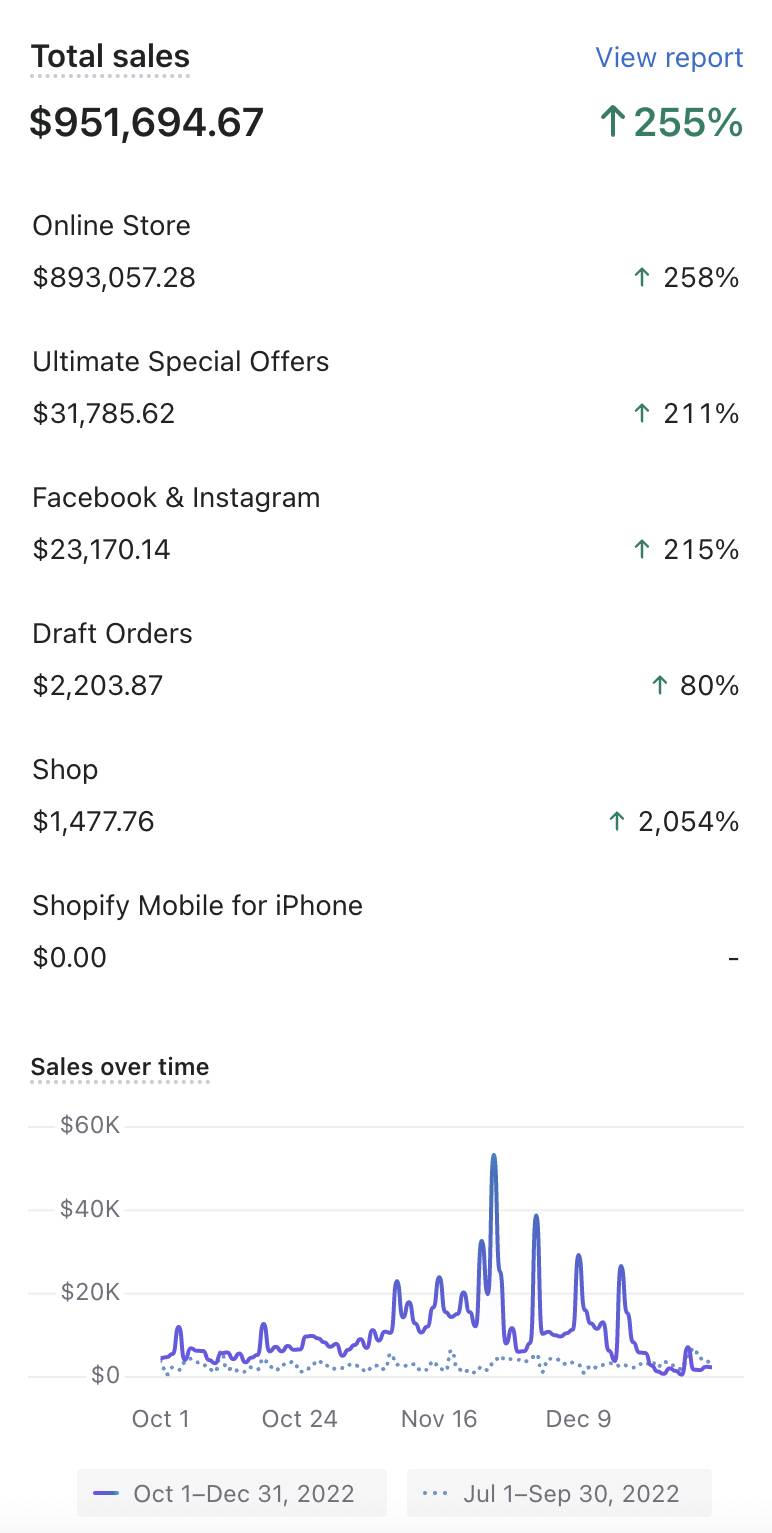
$951K Q4 2022 — ↑255% (Oct–Dec, Mobile View)
Hyros — 3-Month Source Stats: $460K Revenue
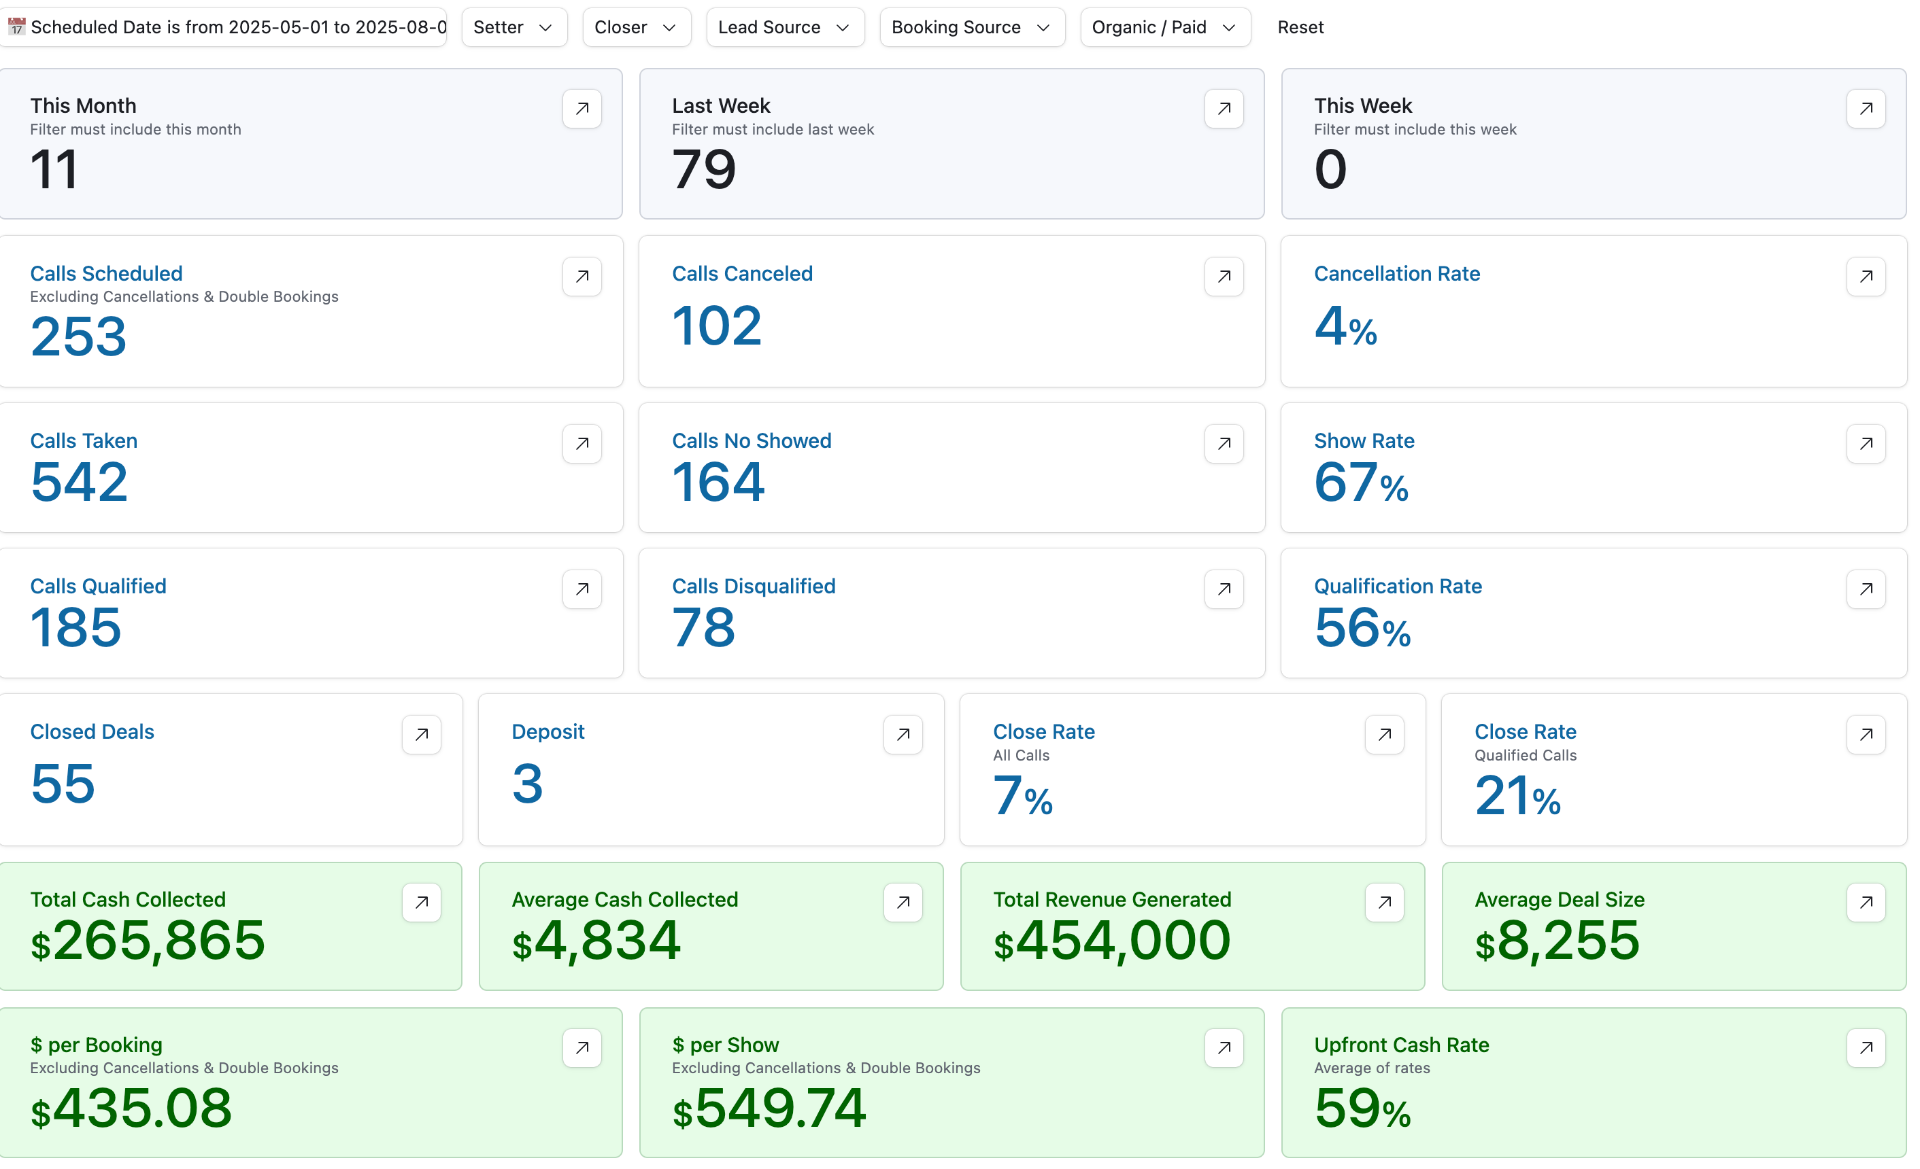
CRM — May–Aug 2025 (90 Days): 253 Calls, 55 Deals, $454K Revenue
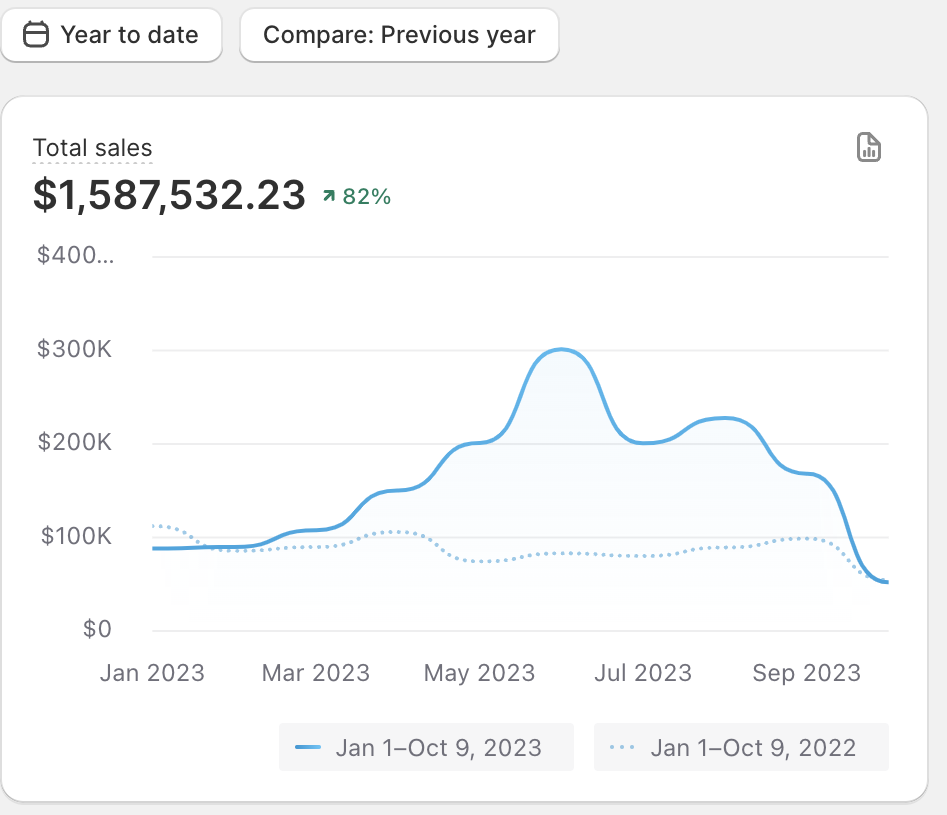
$1.59M YTD Sales (2023) — ↑82% YoY
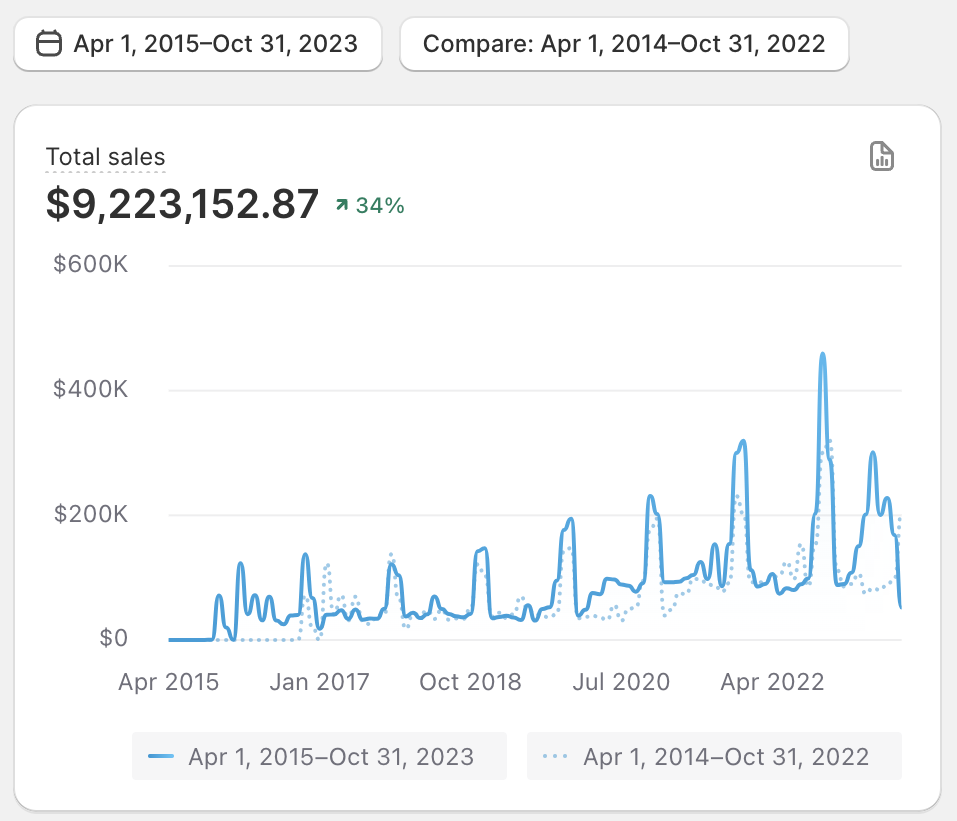
$9.2M All-Time Sales — ↑34% Growth
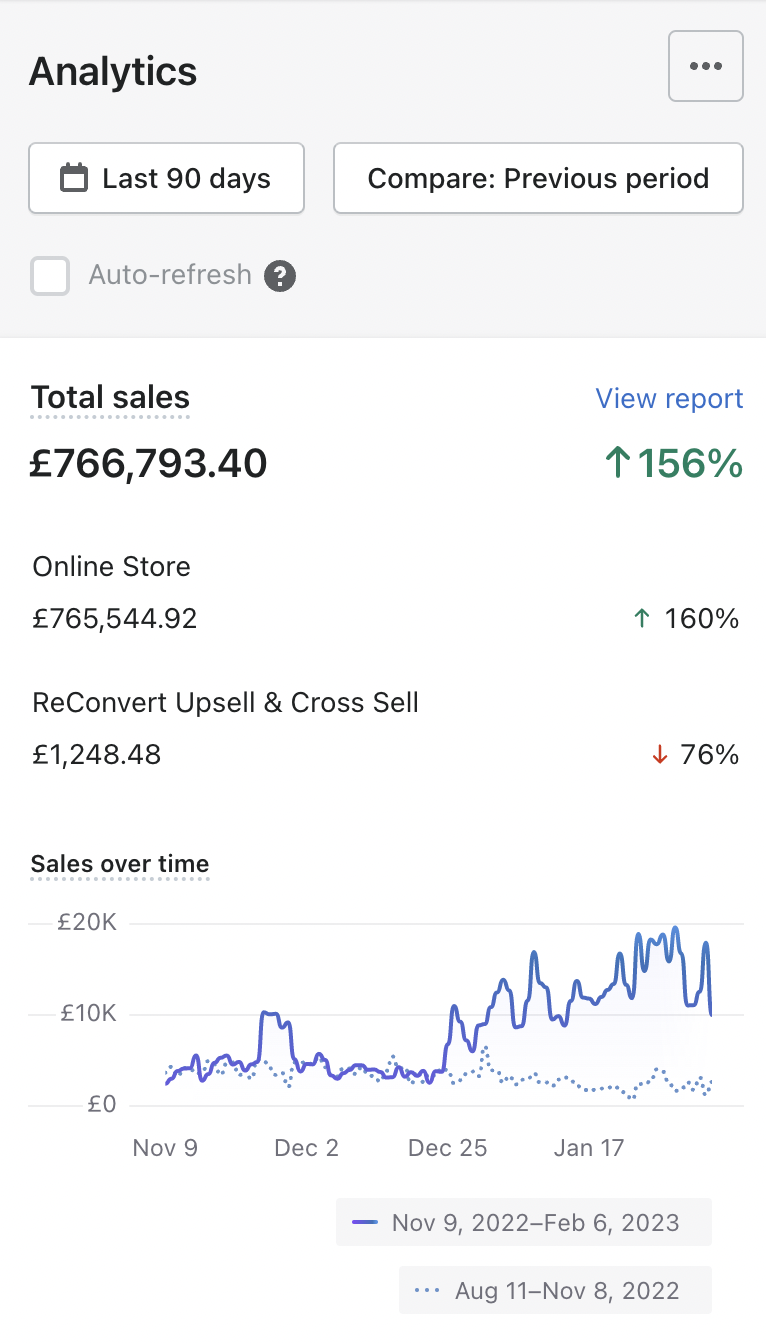
£766K Last 90 Days — ↑156% (Nov 2022 – Feb 2023)
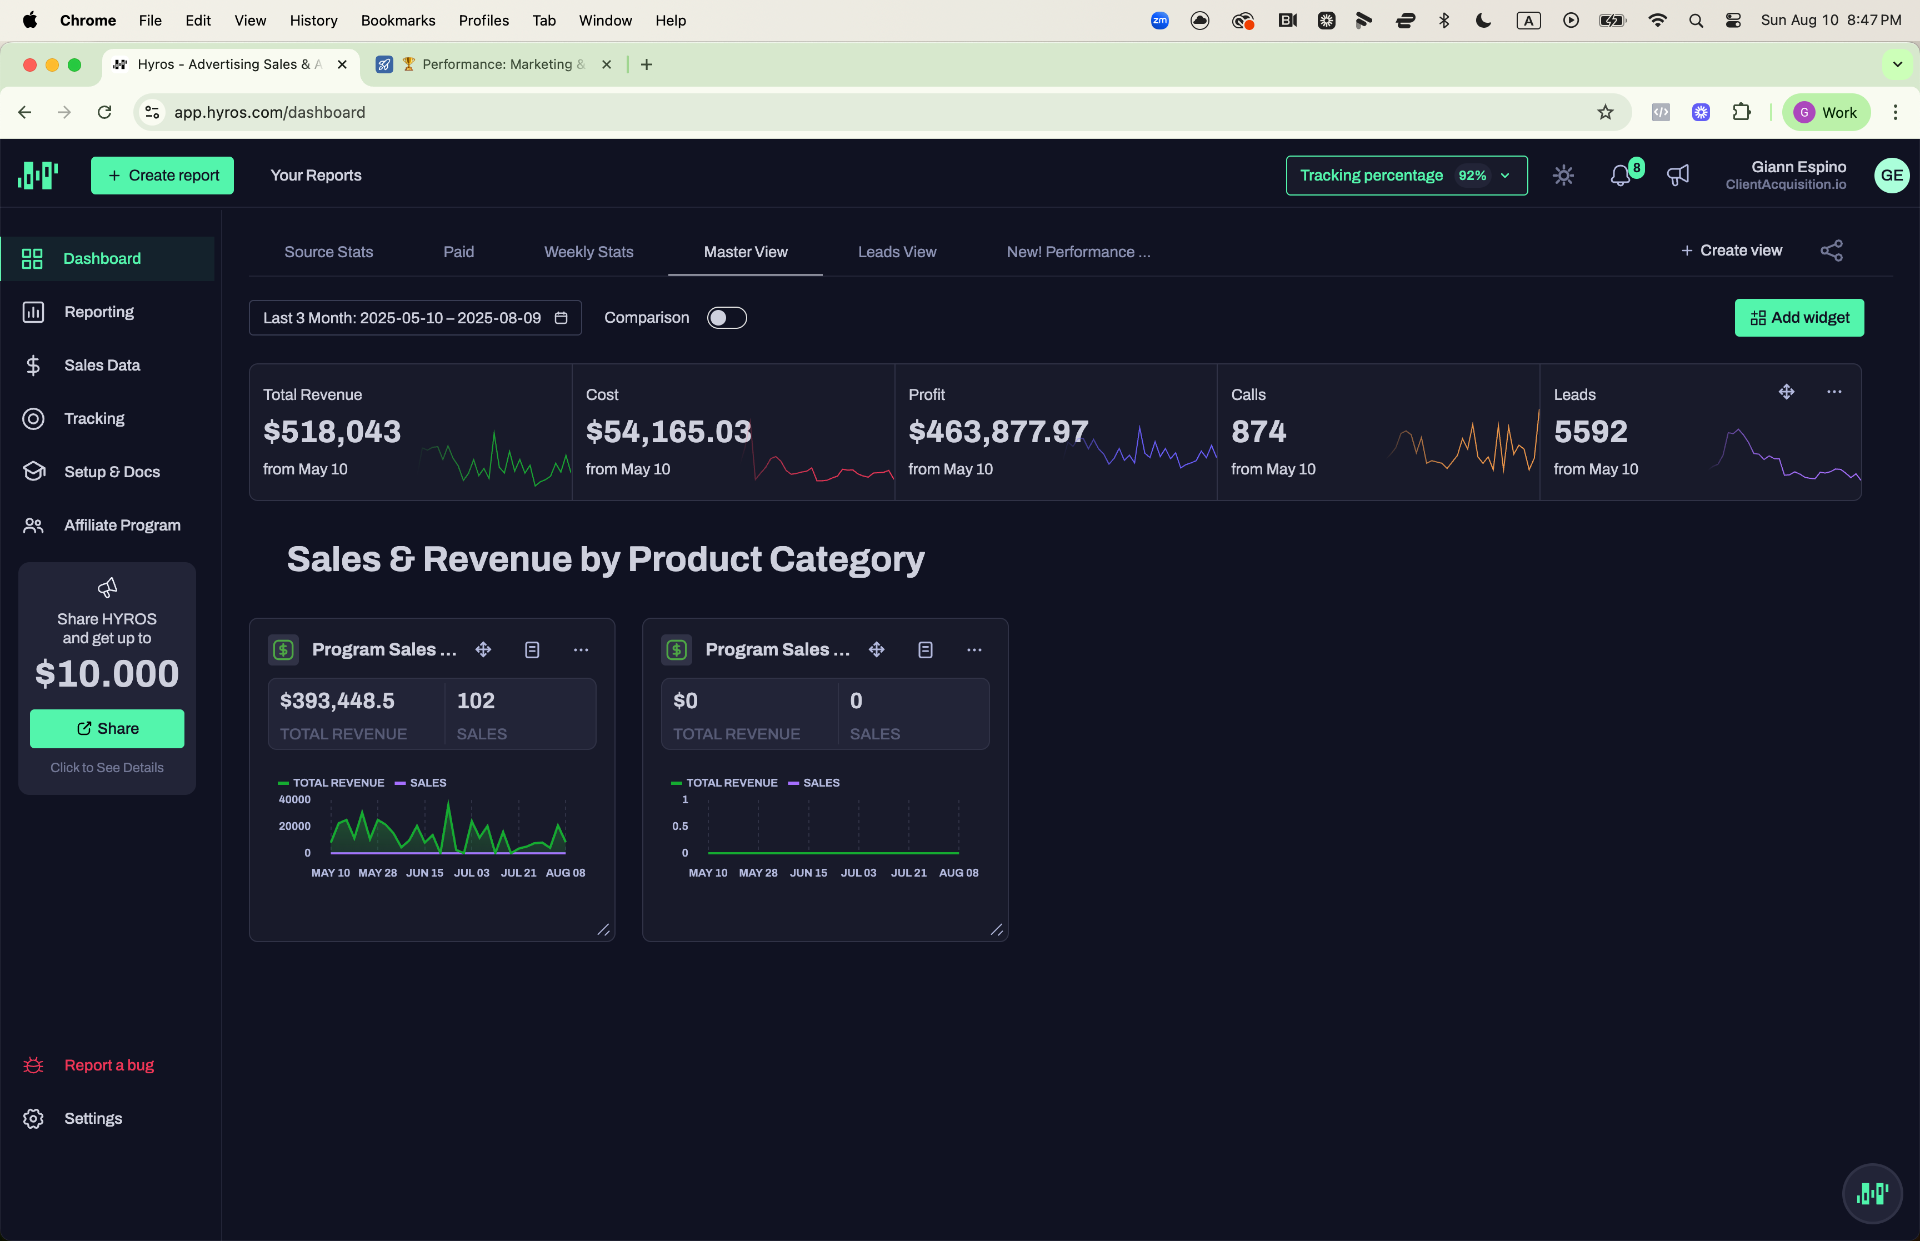
Hyros — 3-Month Master View: $518K Revenue, 874 Calls
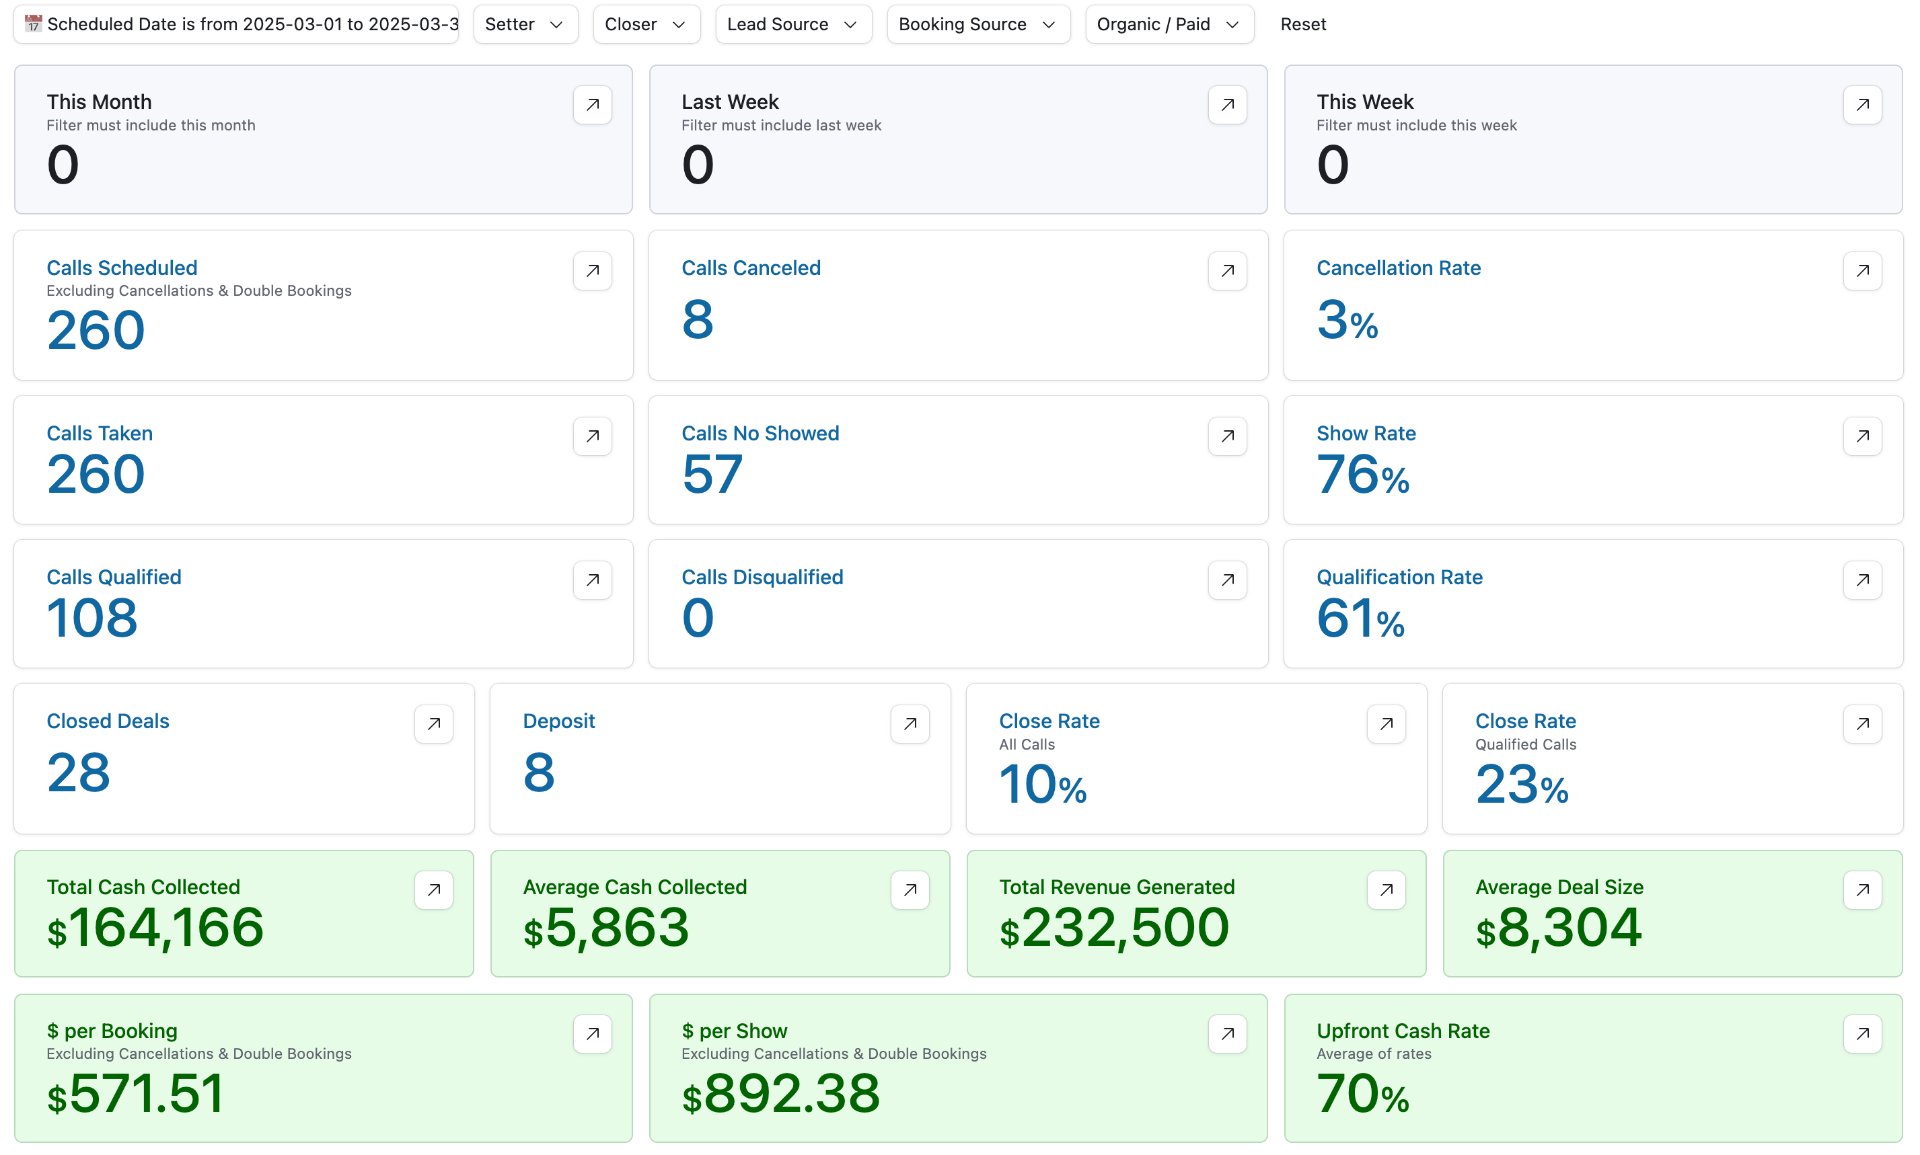
CRM — March 2025 (30 Days): 260 Calls, 28 Deals, $232K Revenue
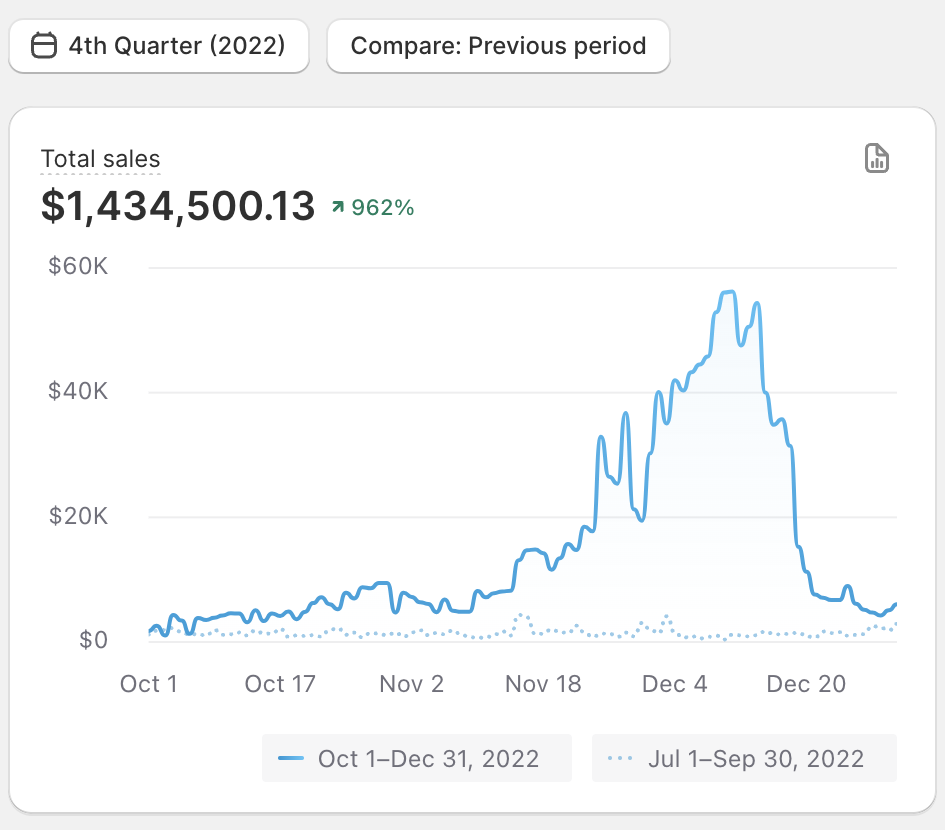
$1.43M Sales in Q4 2022 — ↑962% Growth
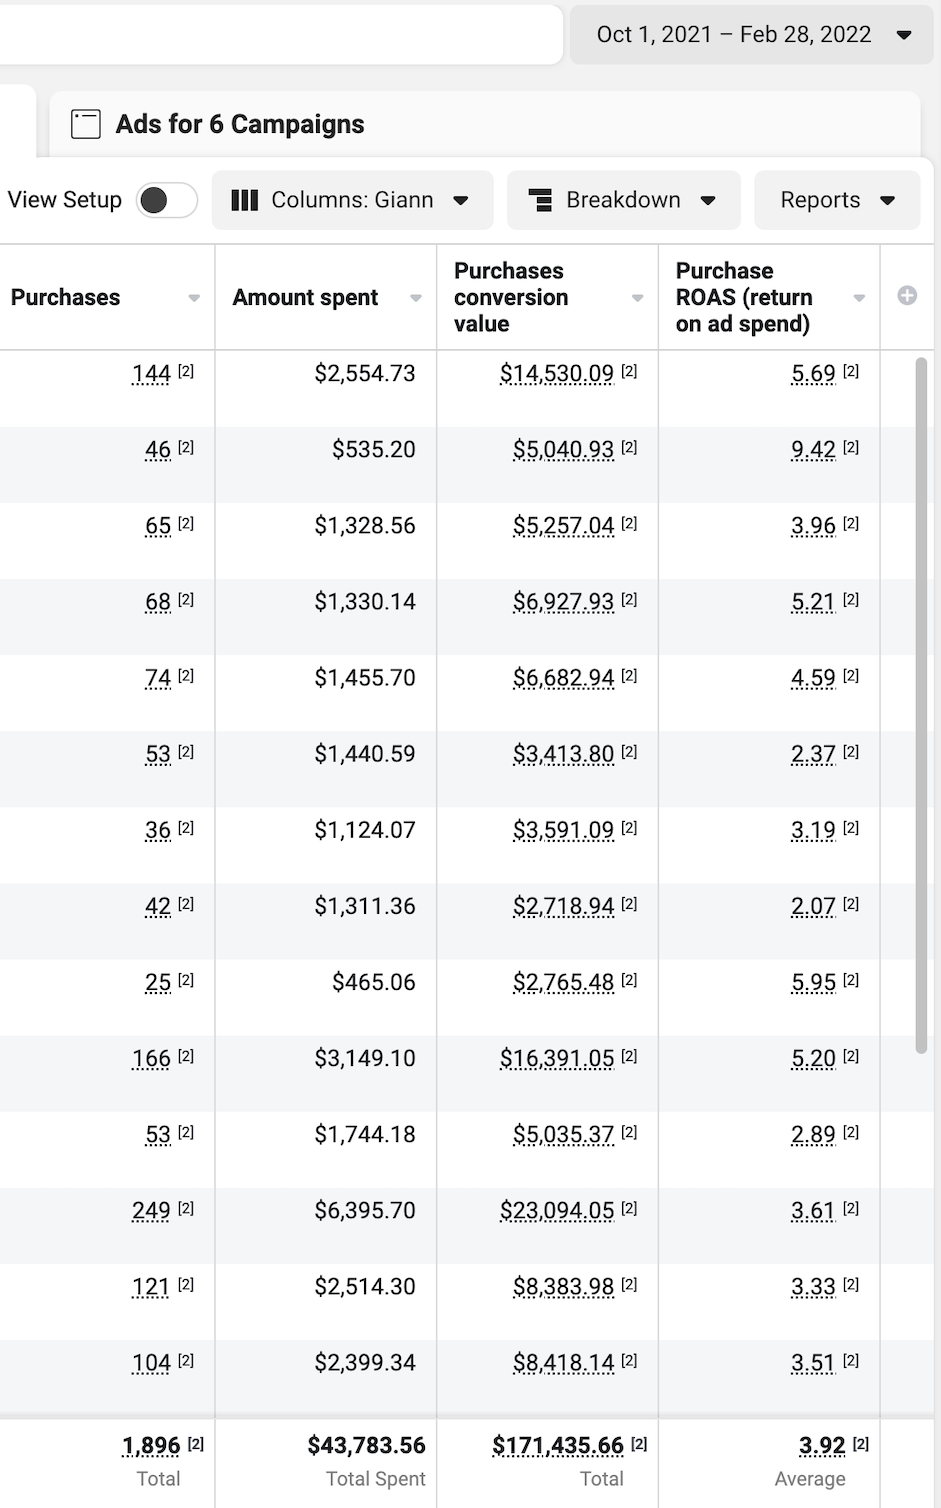
$171K Revenue from $43.7K Spend — 3.92x ROAS (Oct–Feb)
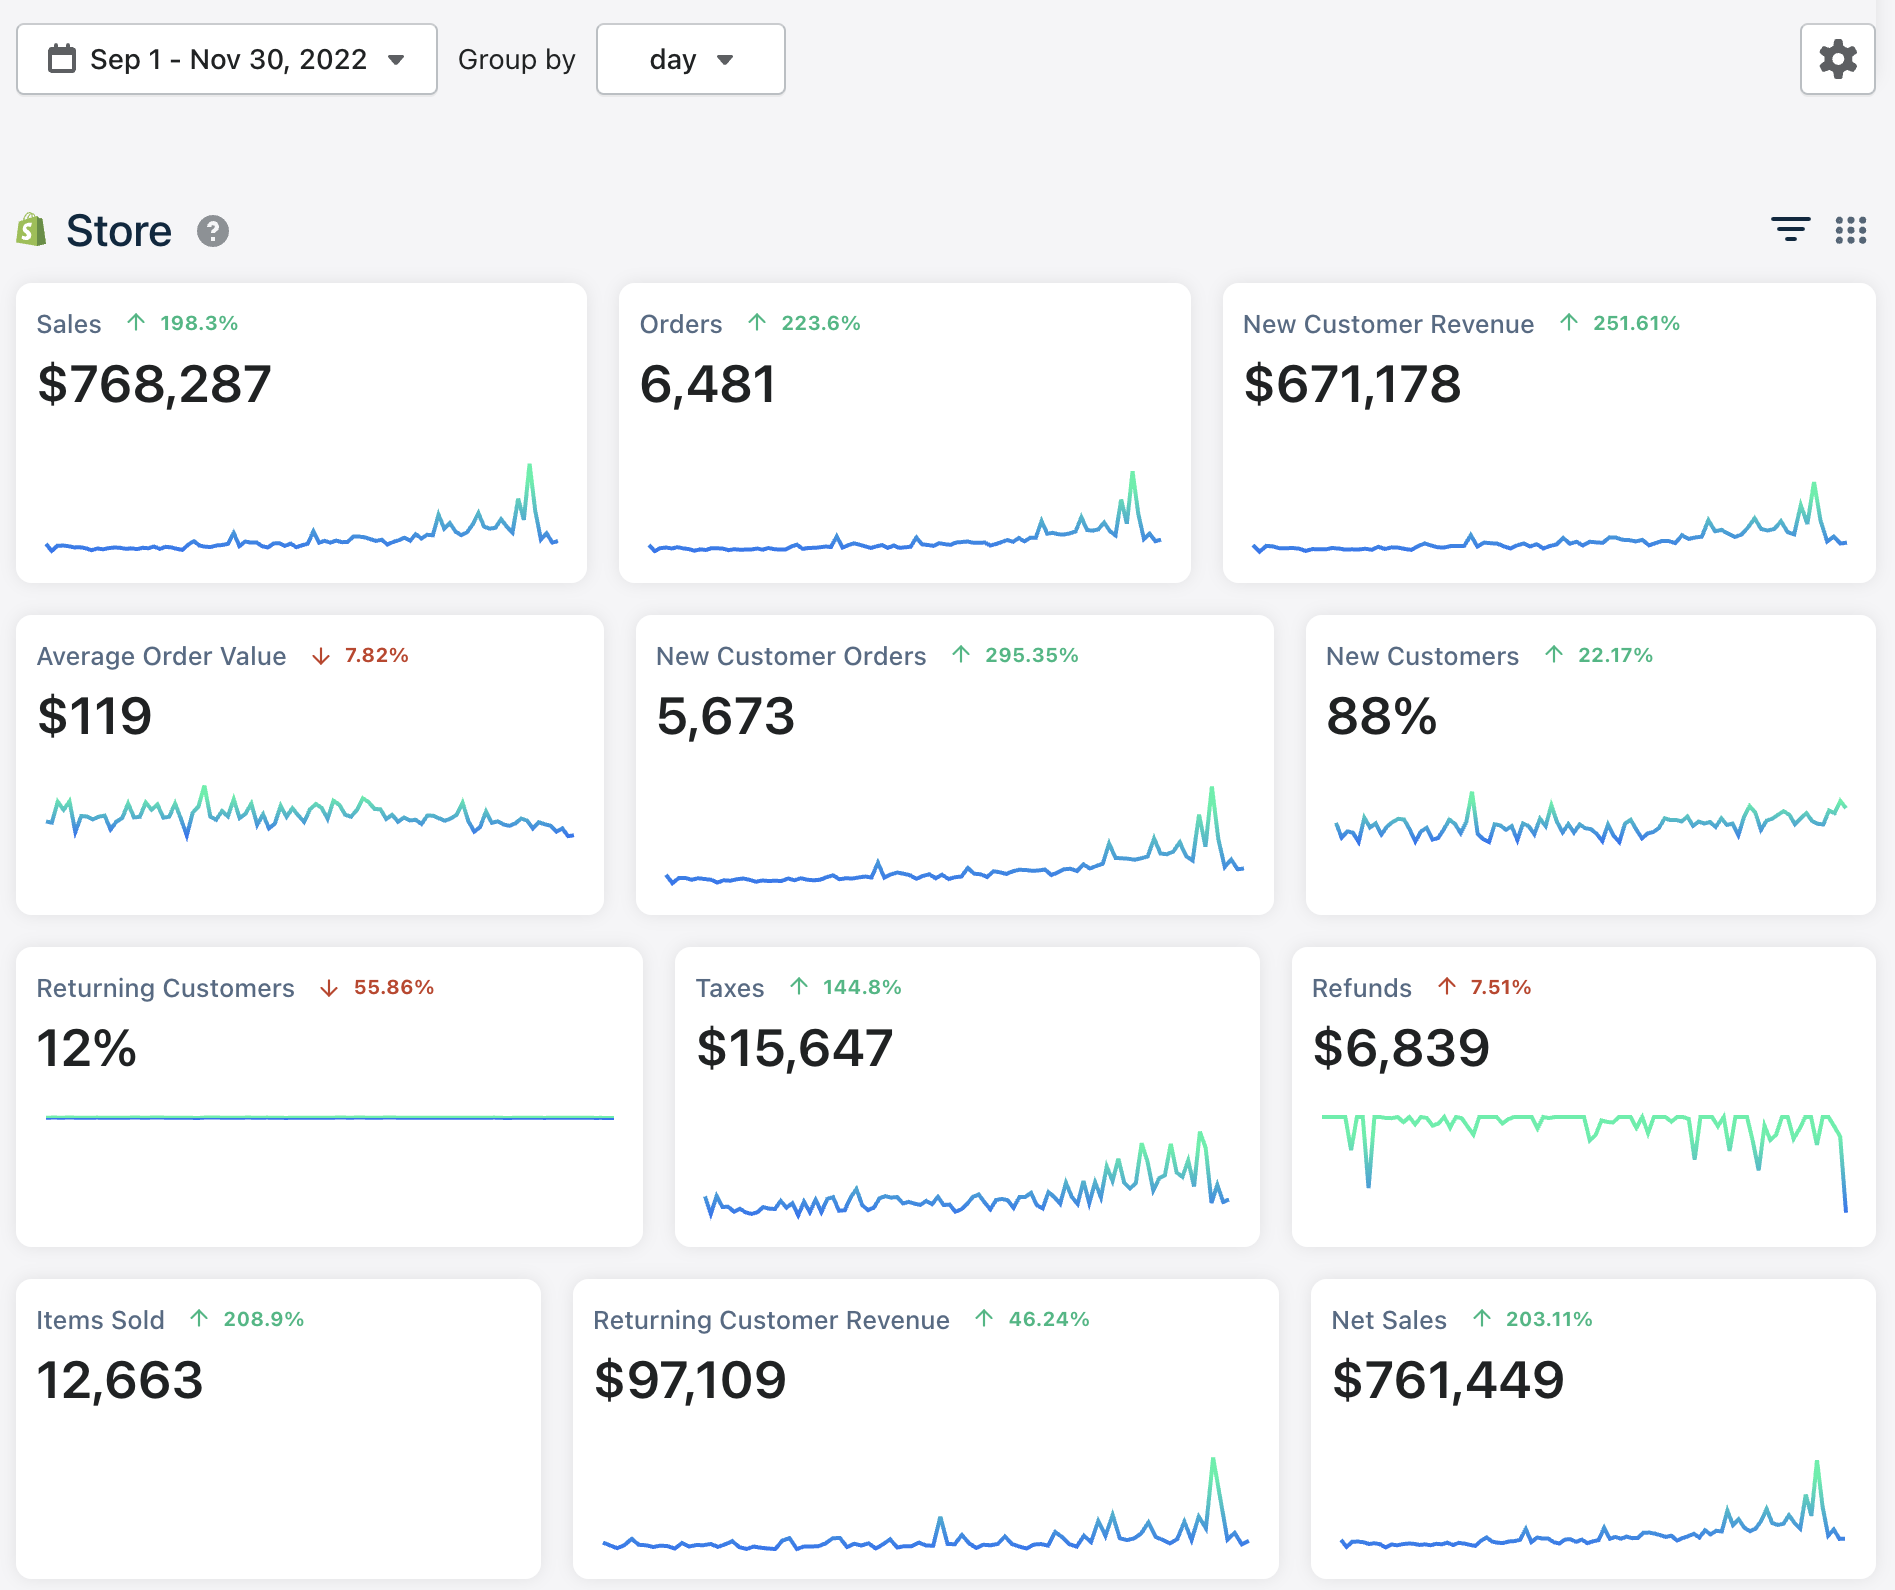
$768K in 3 Months — ↑198% (Sep–Nov 2022)
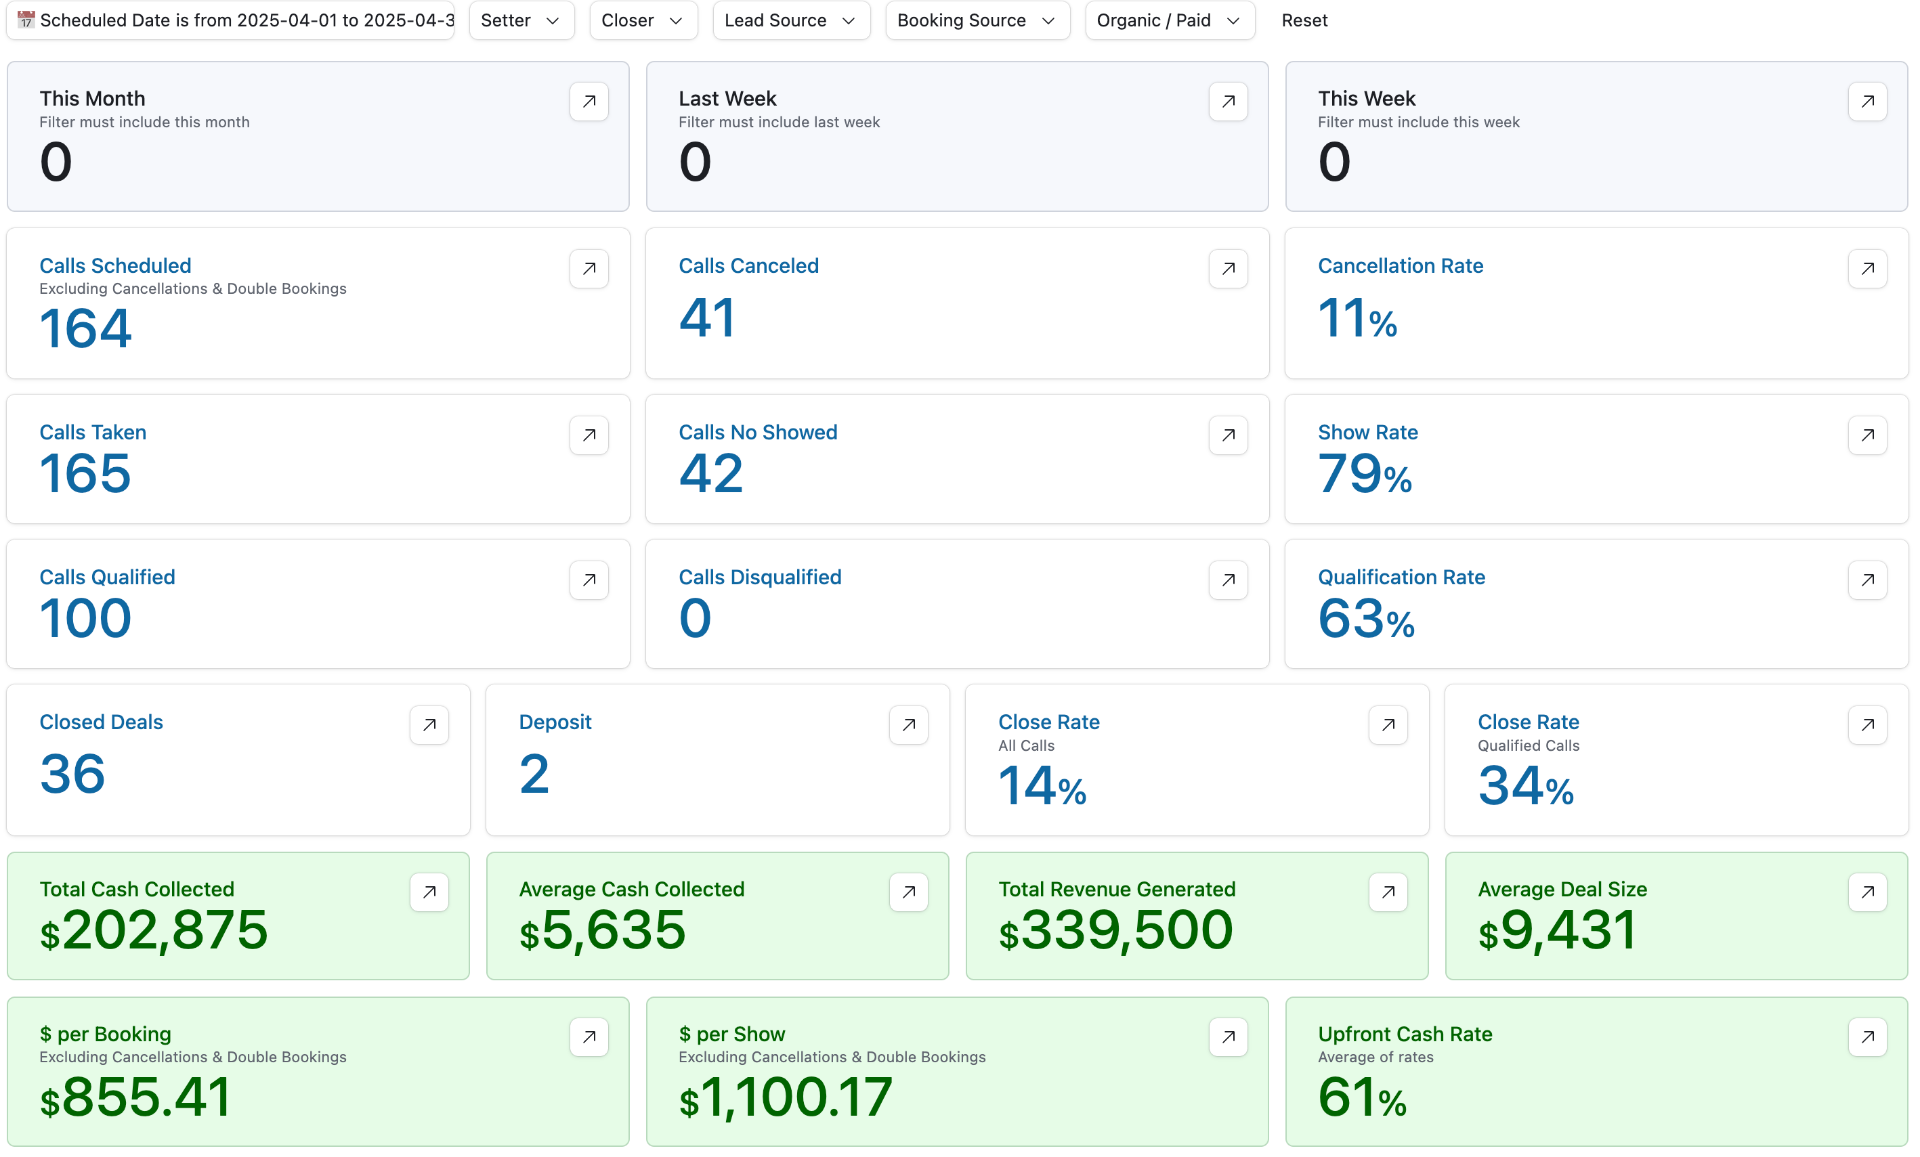
CRM — April 2025 (30 Days): 164 Calls, 36 Deals, $339K Revenue
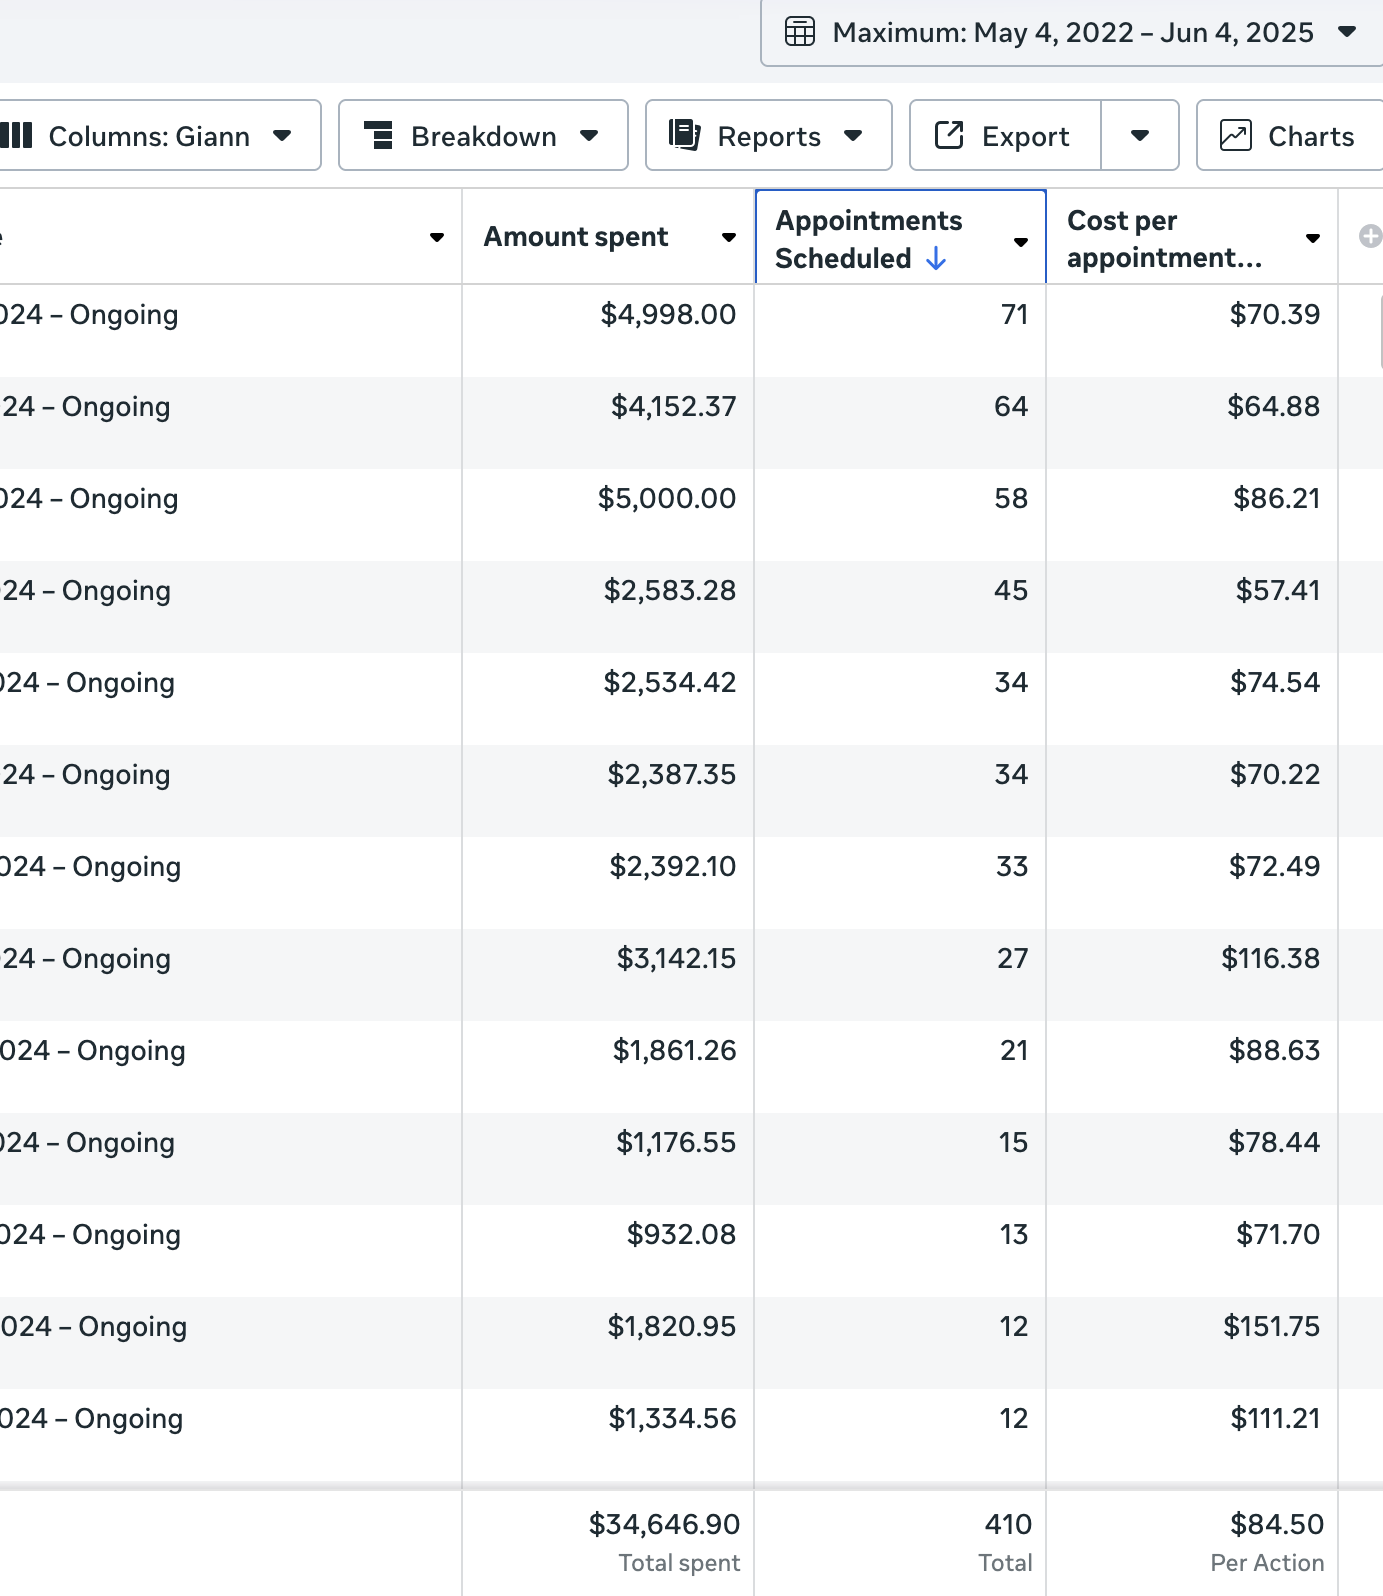
$34.6K Spent → 410 Booked Appointments
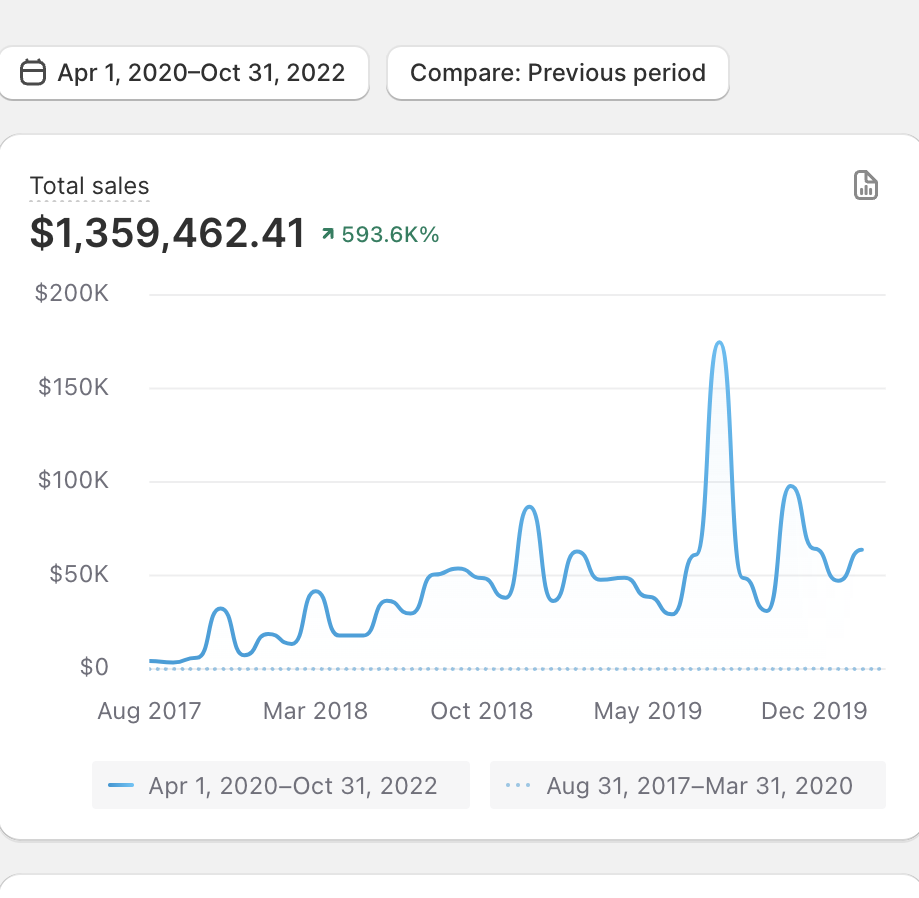
$1.36M Sales (Apr 2020 – Oct 2022) — ↑593K%
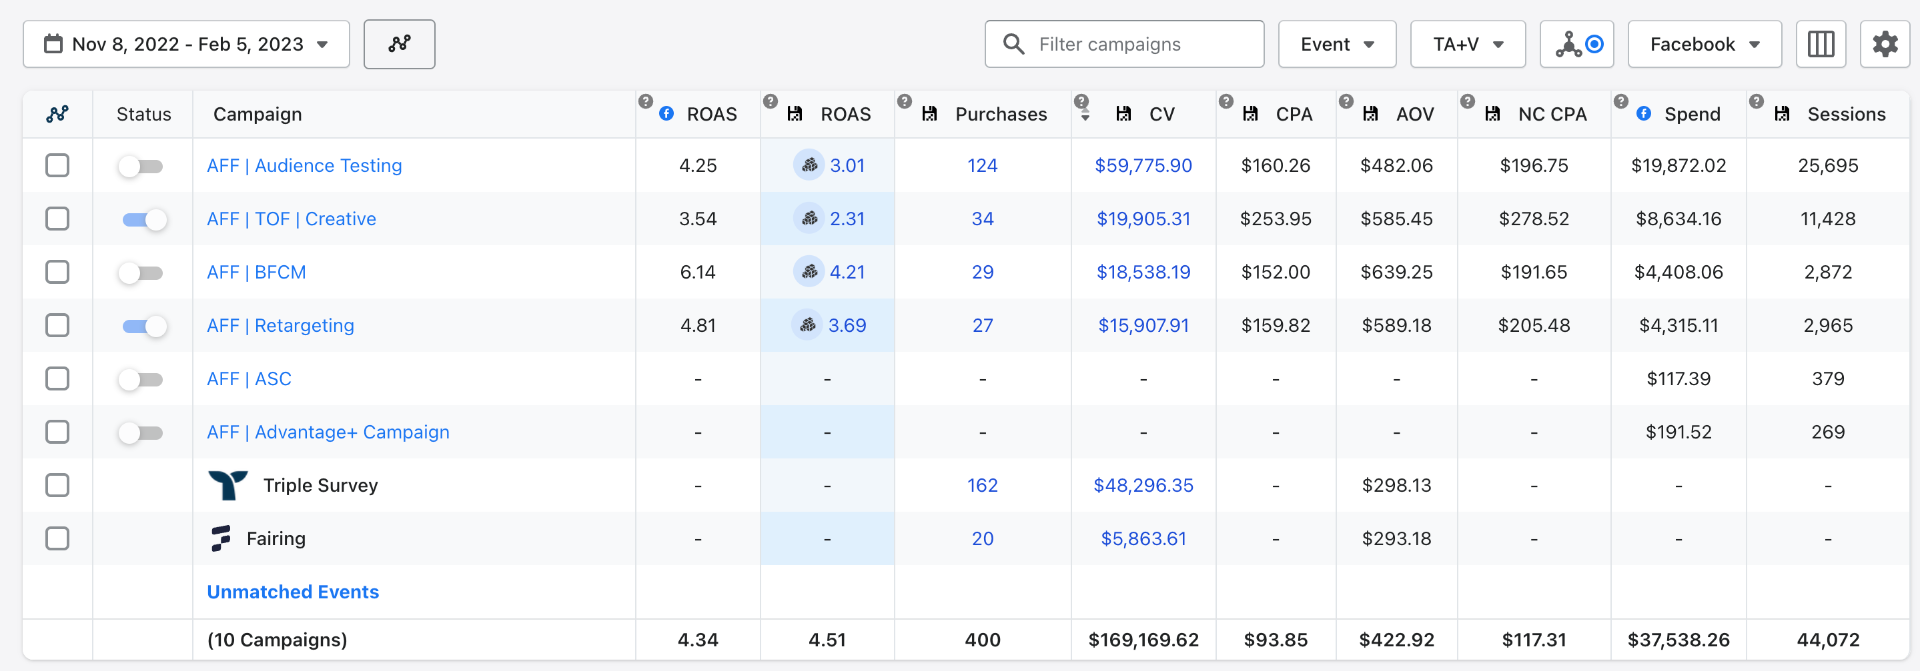
$169K CV — 4.51x ROAS (Facebook, 90 Days)
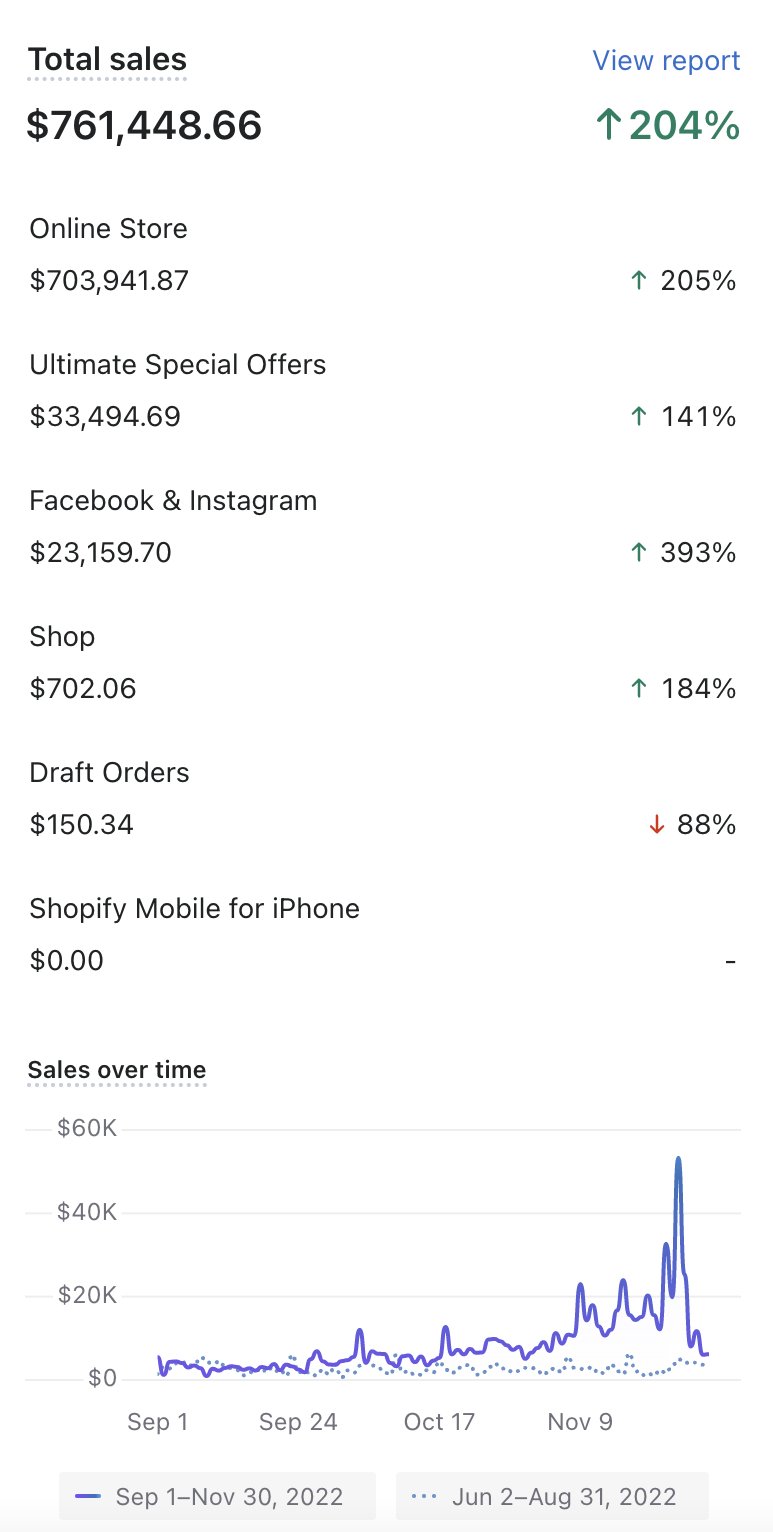
$761K Sep–Nov 2022 — ↑204% (Mobile View)
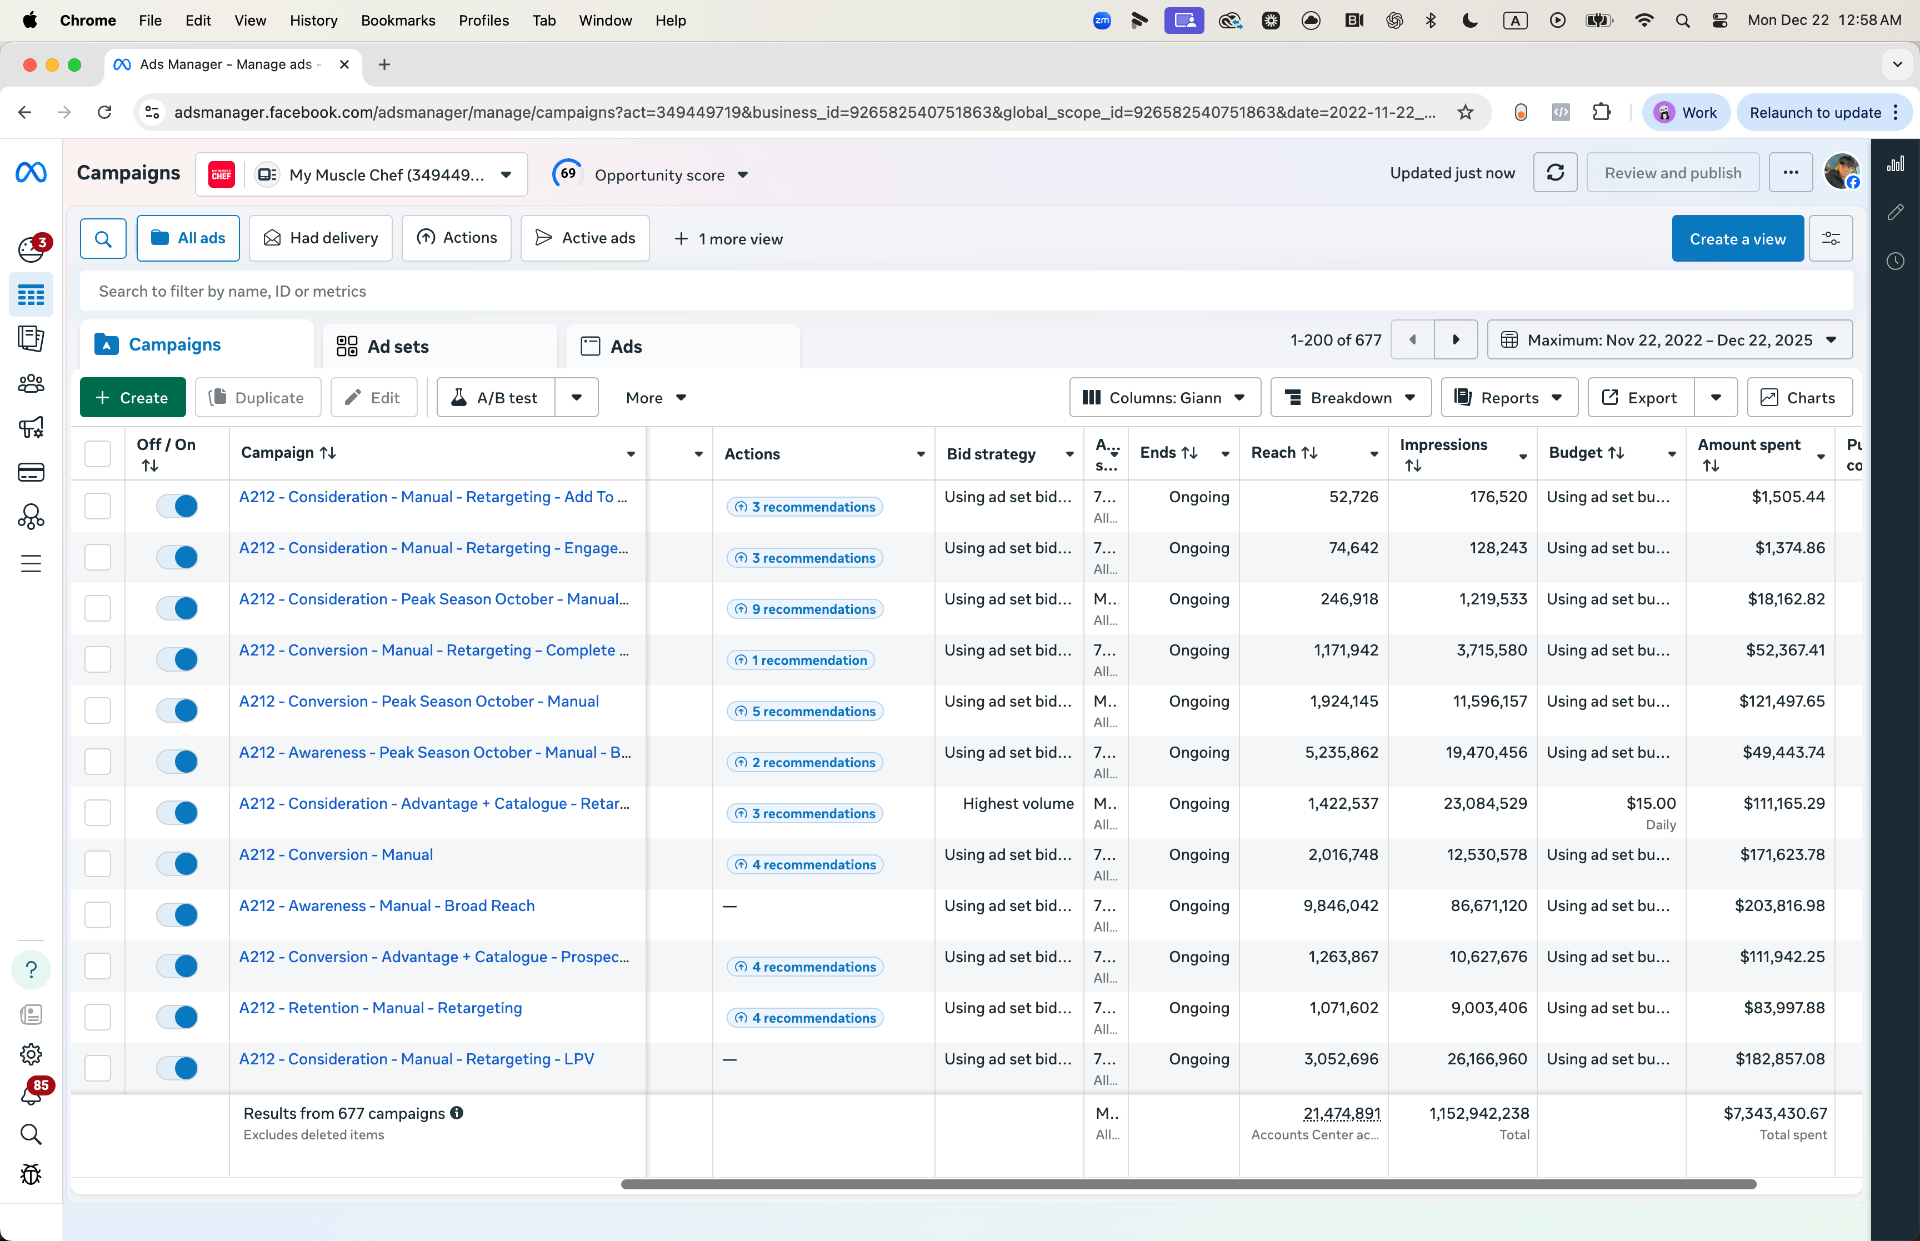
Meta Ads Manager — $7.34M Spent, 677 Campaigns (Full View)
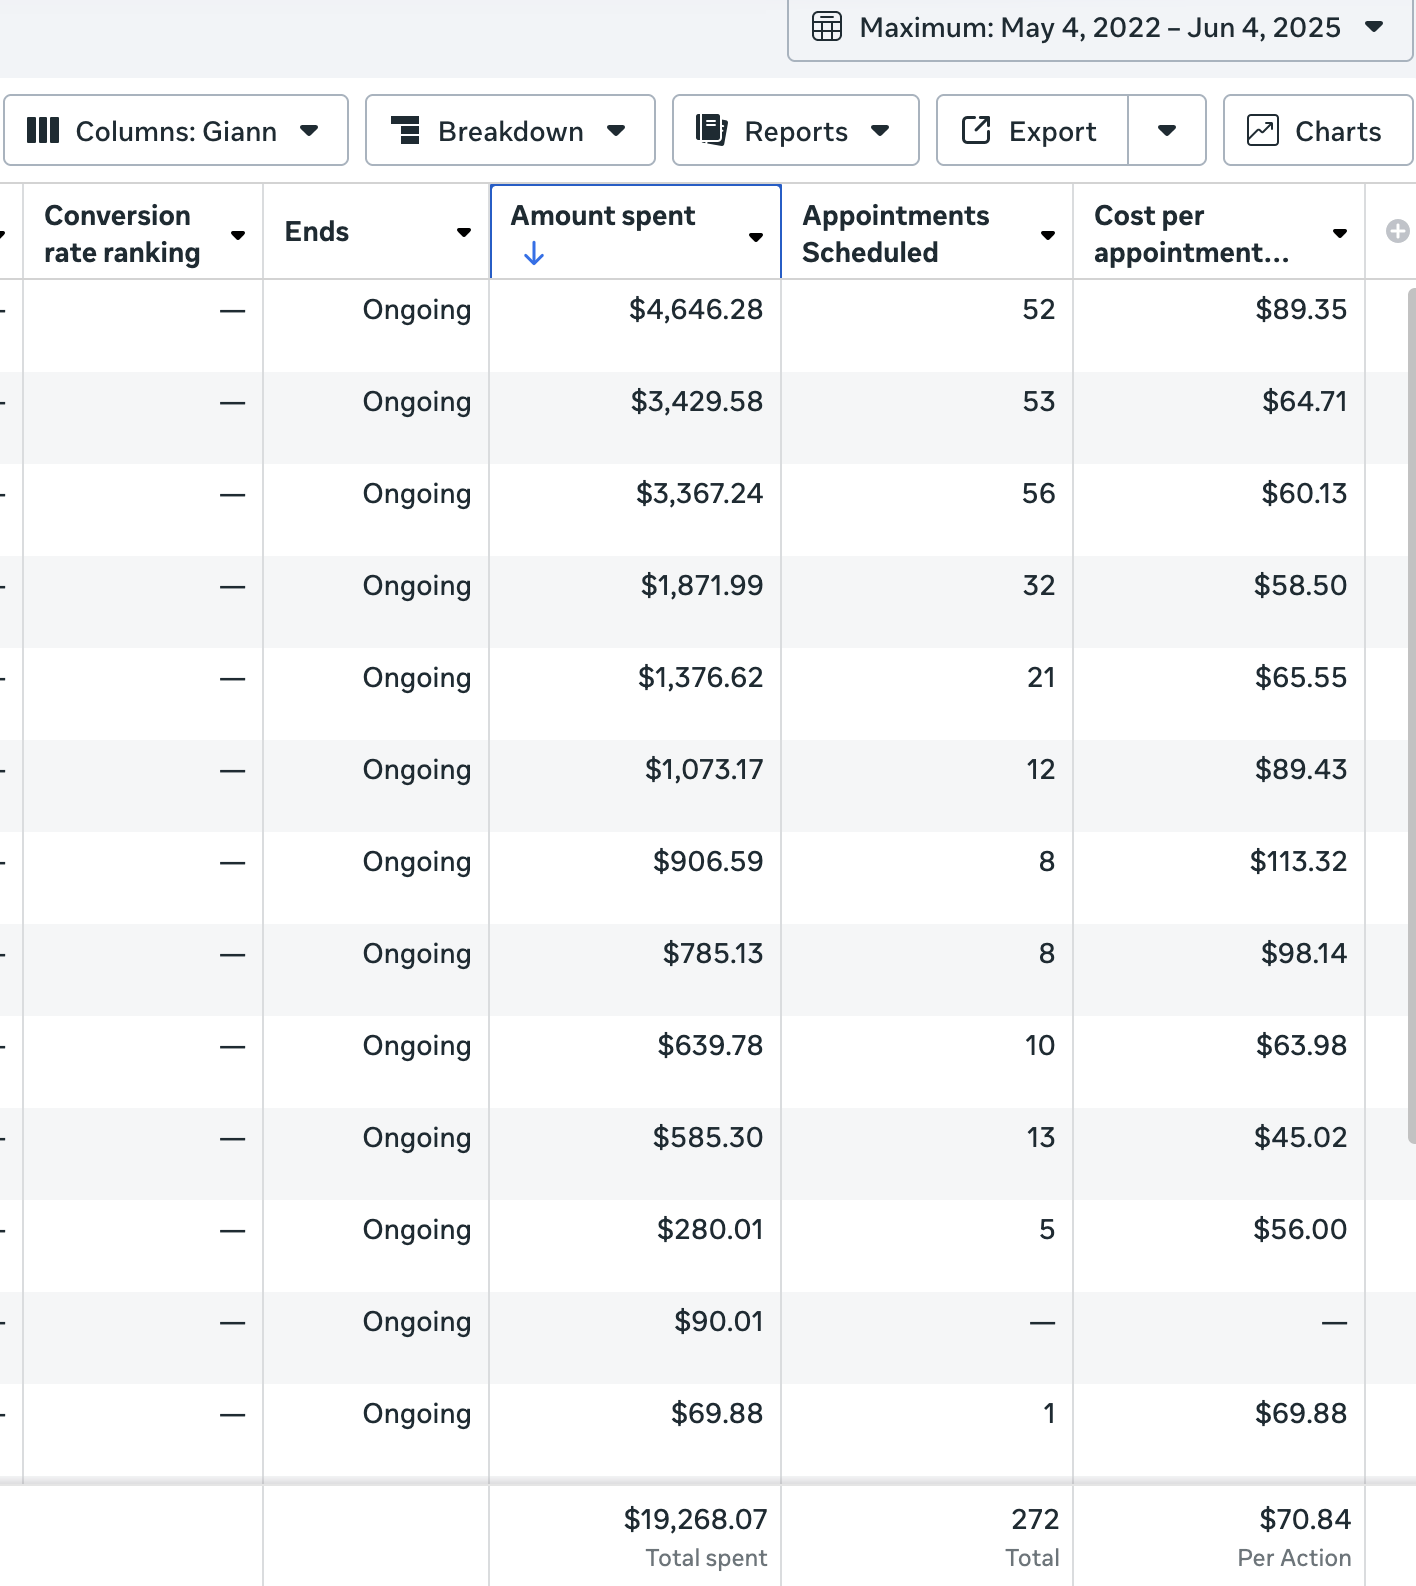
$19K Spent → 272 Booked Appointments
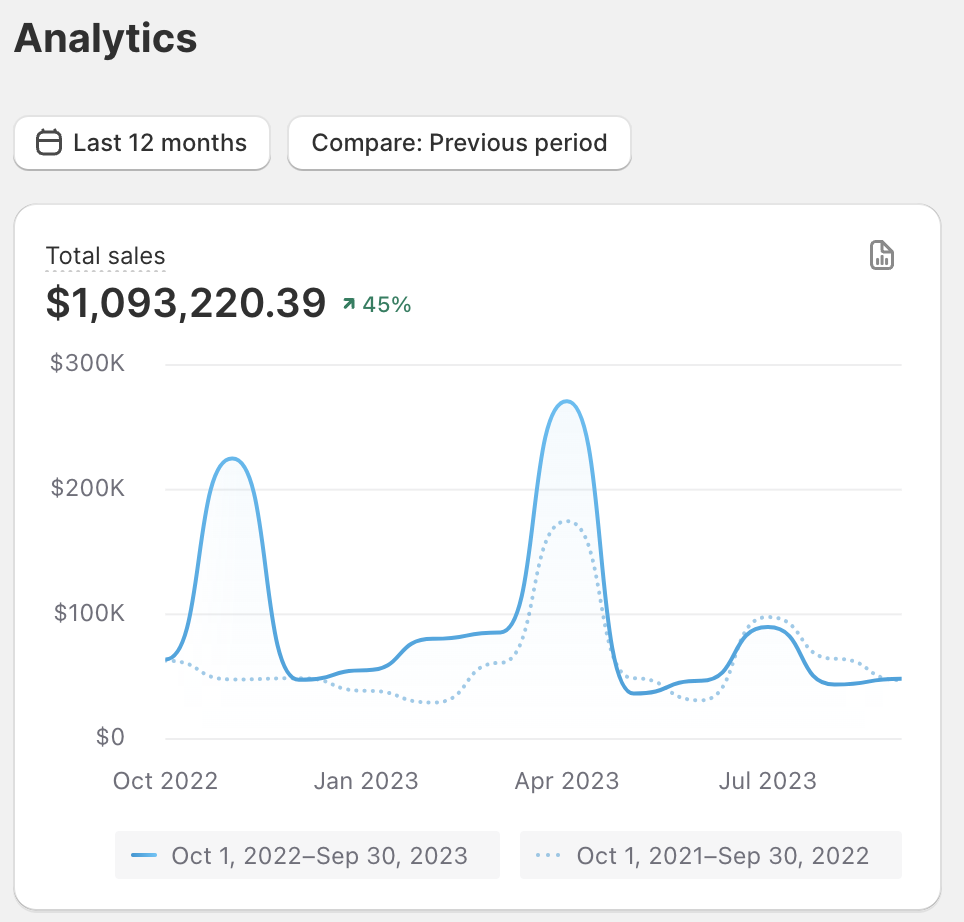
$1.09M Sales in 12 Months — ↑45% YoY
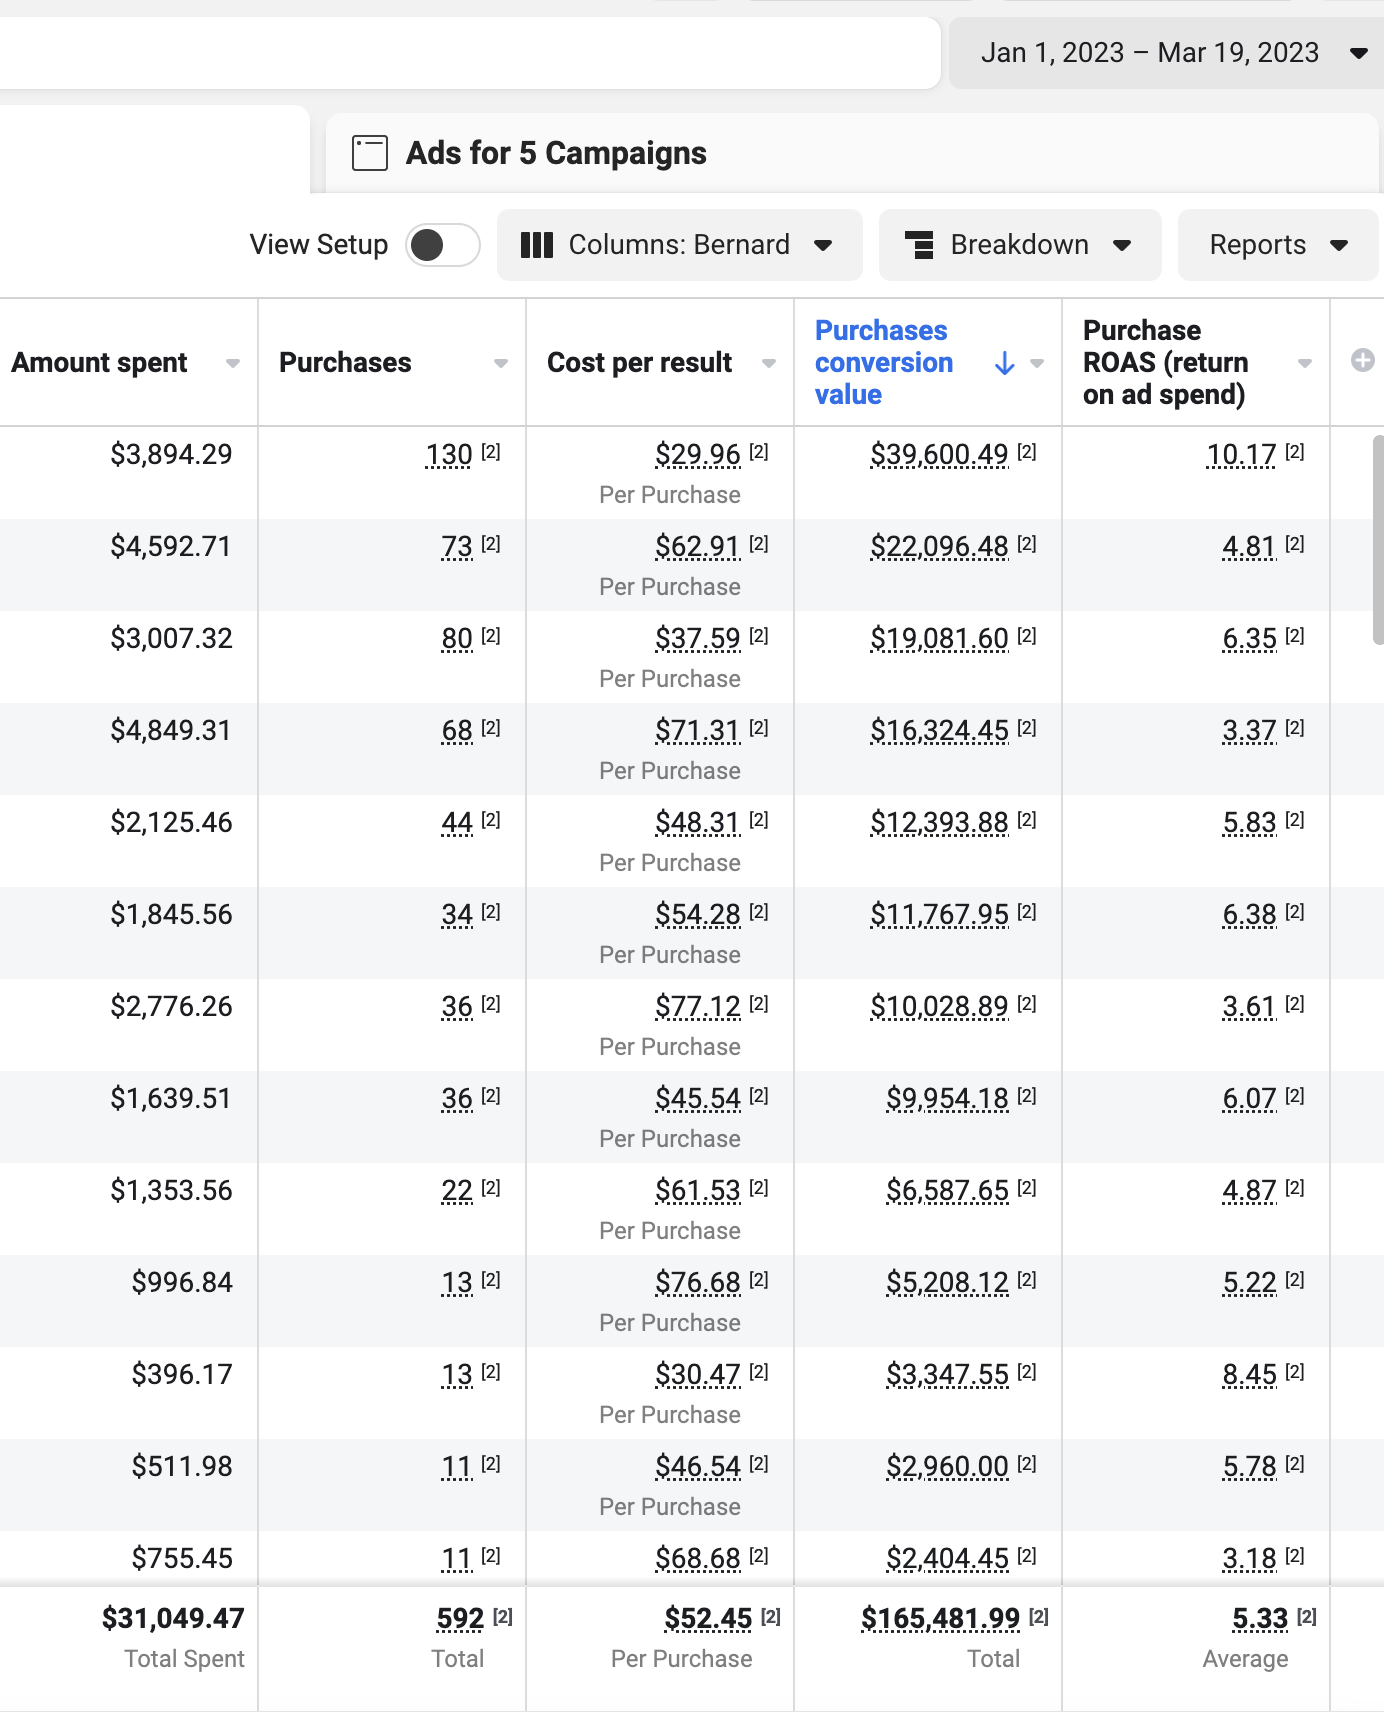
$165K Revenue from $31K Spend — 5.33x ROAS (Q1 2023)
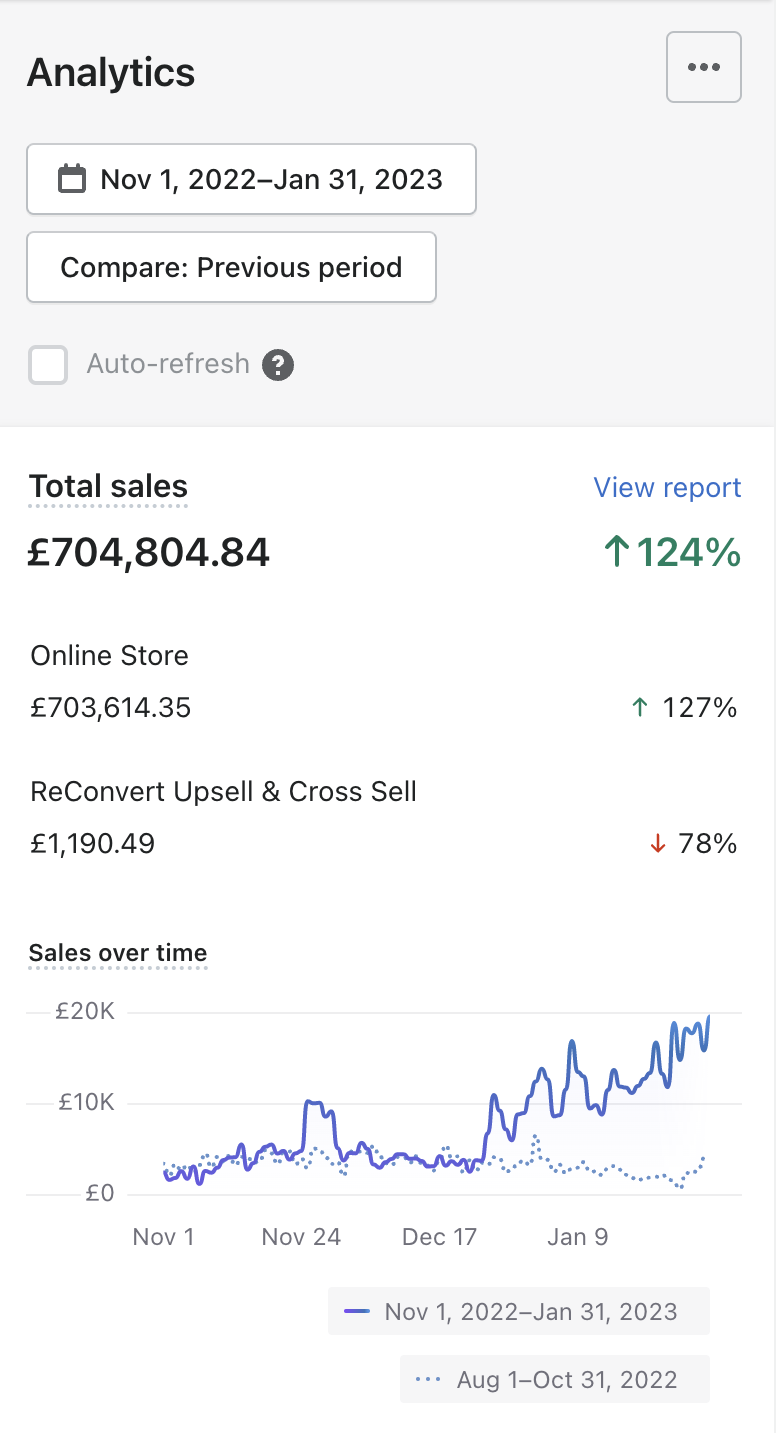
£704K in 3 Months — ↑124% (Nov 2022 – Jan 2023)
$7.3M+ Total Ad Spend Managed
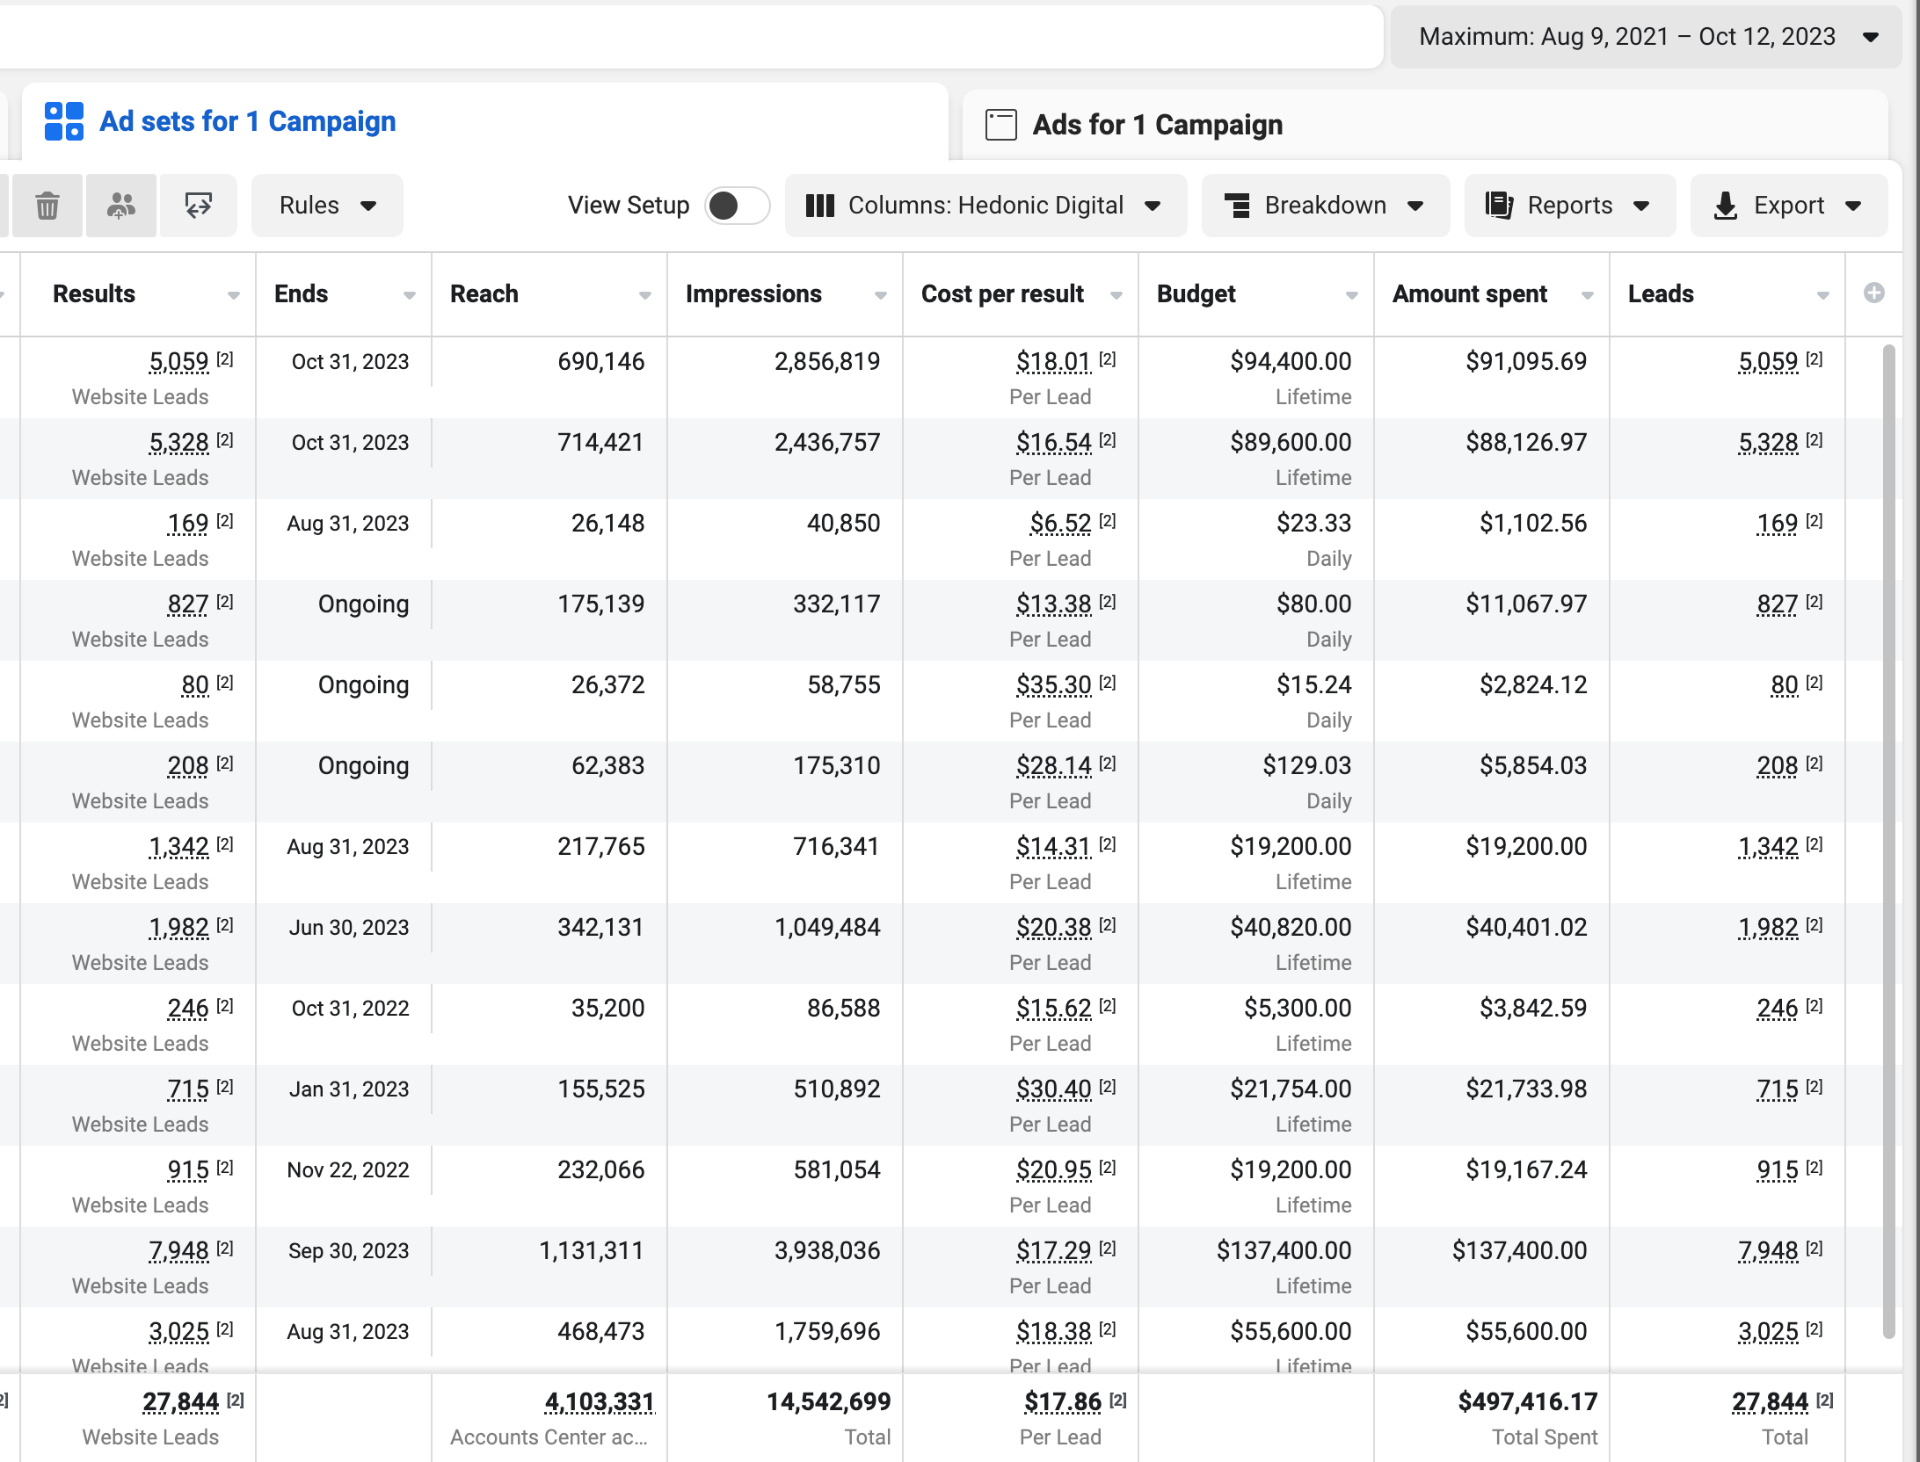
$497K Spent → 27,844 Leads (Full Breakdown)
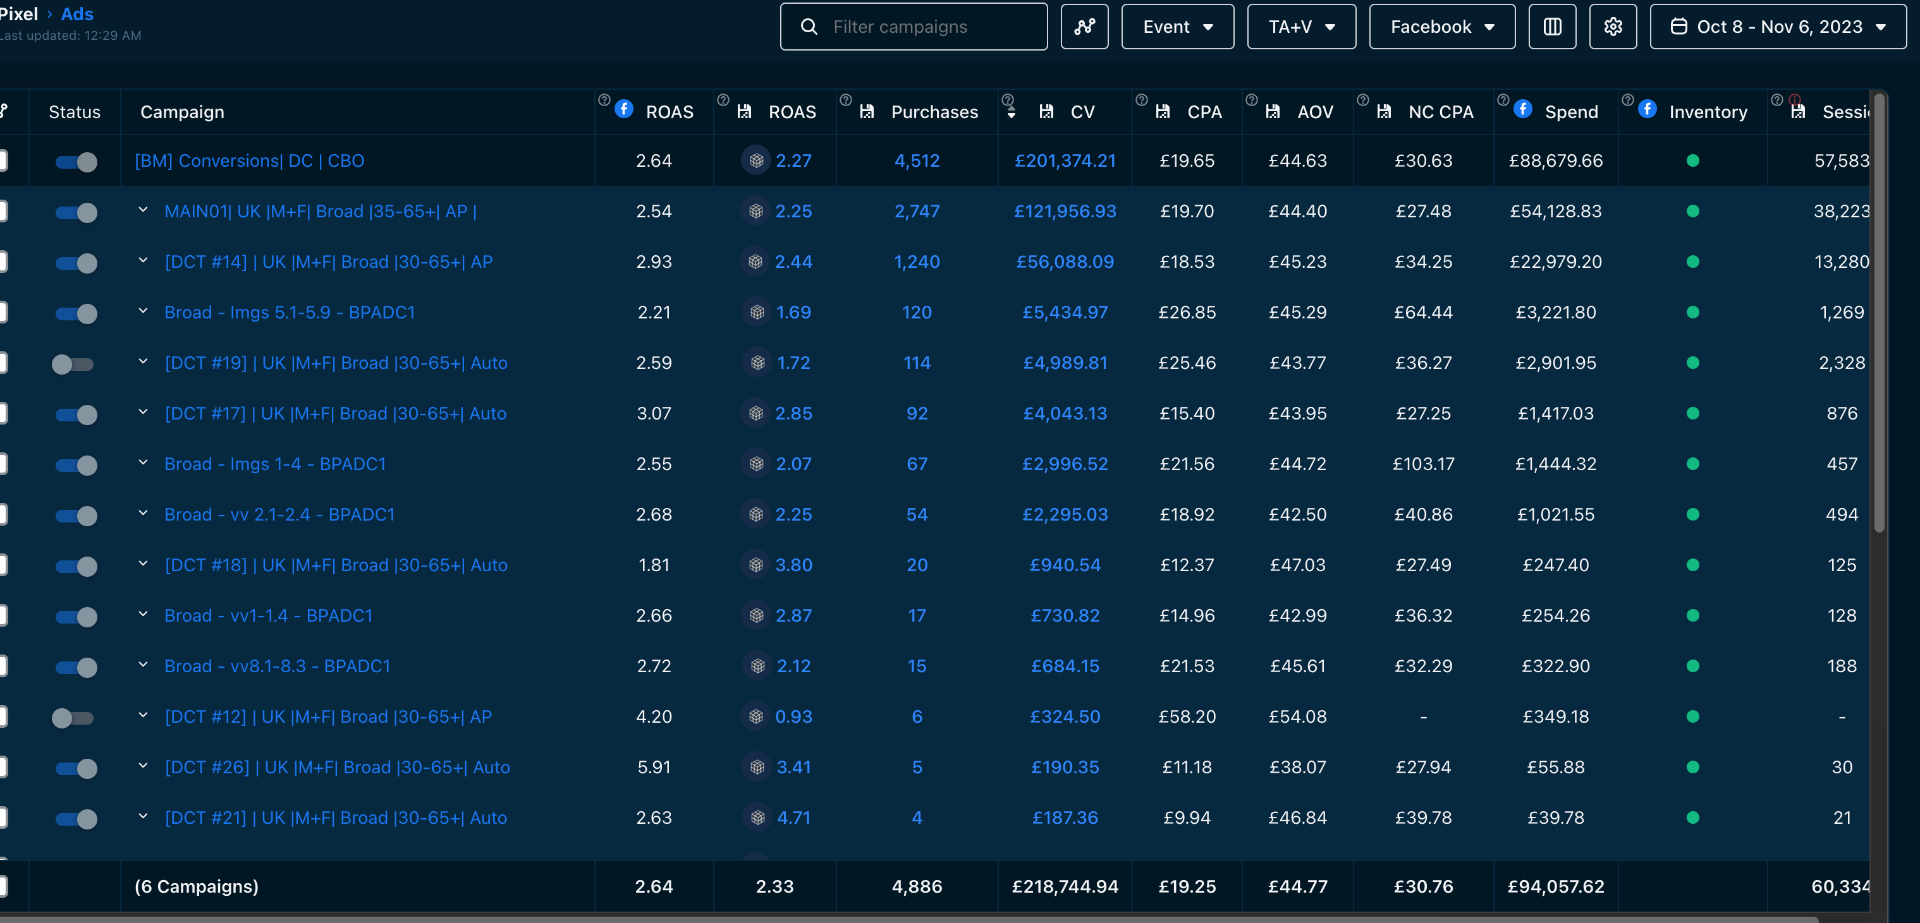
£218K Revenue — 2.33 ROAS (Facebook Campaigns)
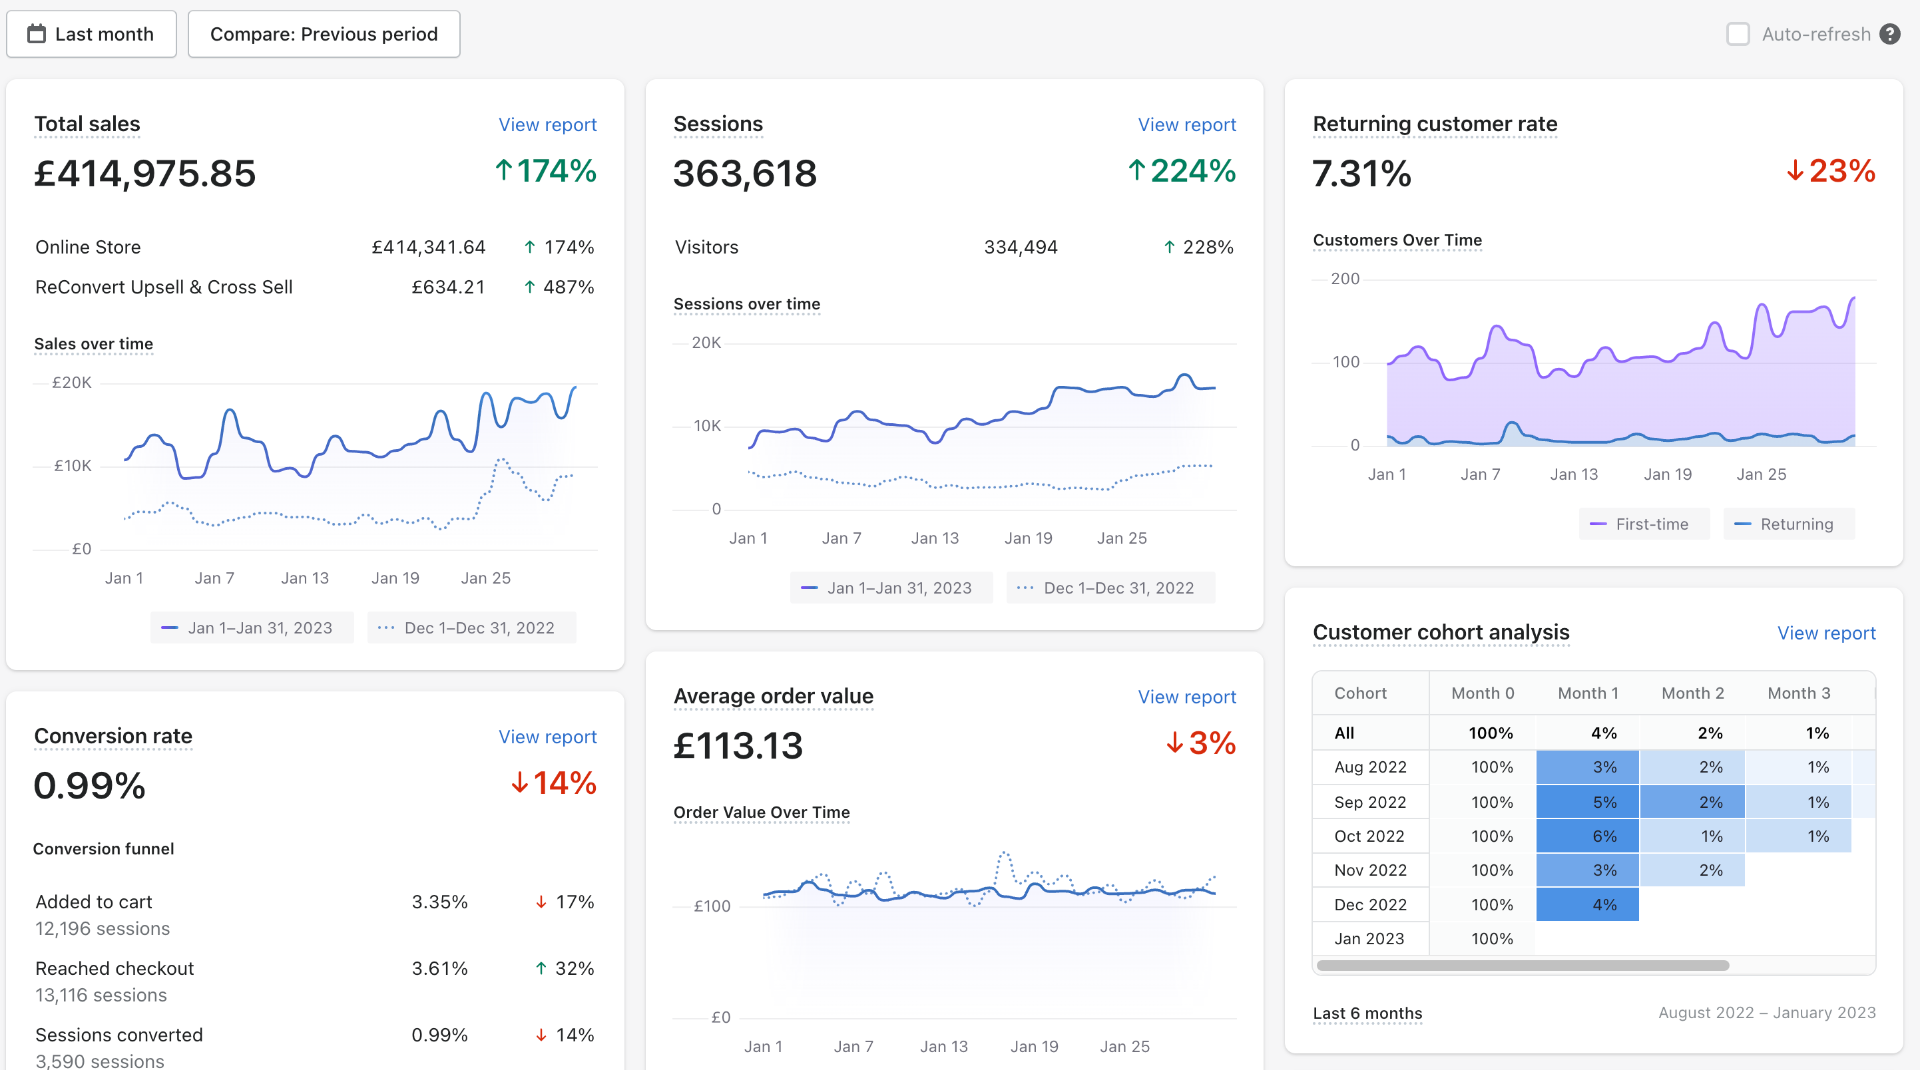
£414K January 2023 — ↑174% (363K Sessions)
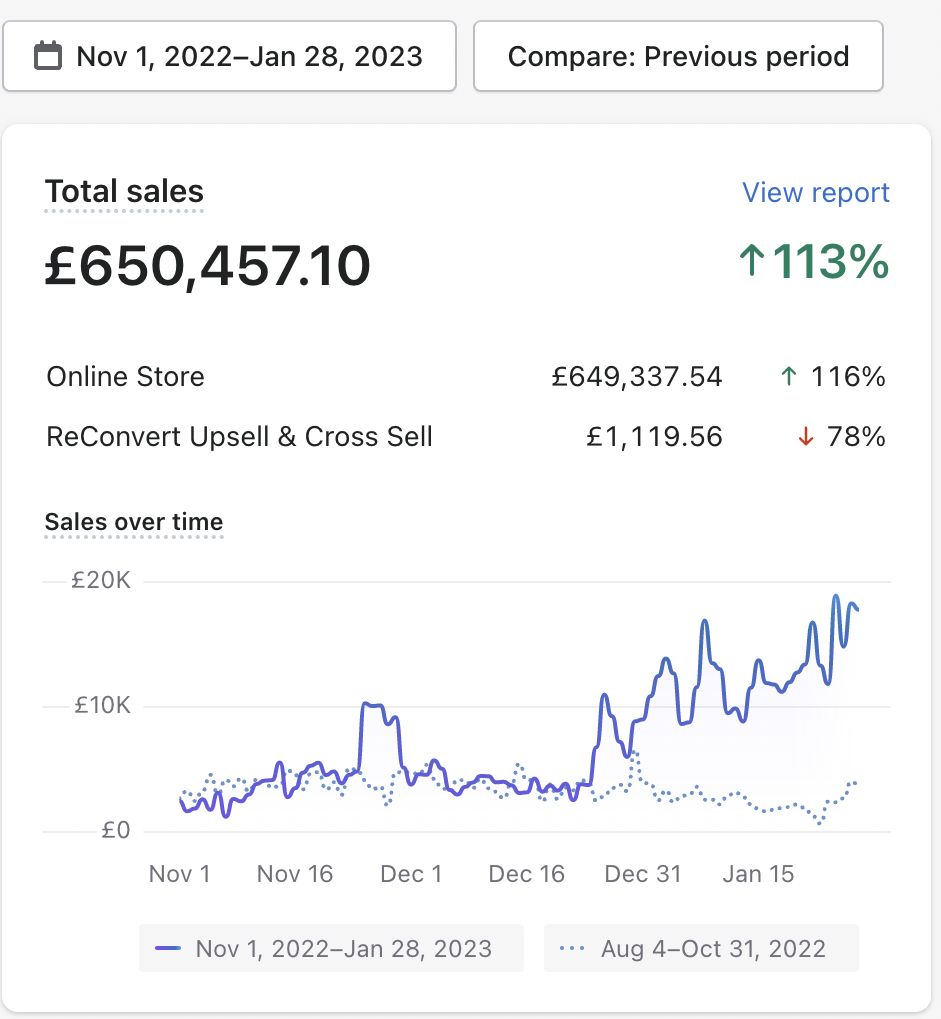
£650K Q4 Revenue — ↑113% (Nov 2022 – Jan 2023)
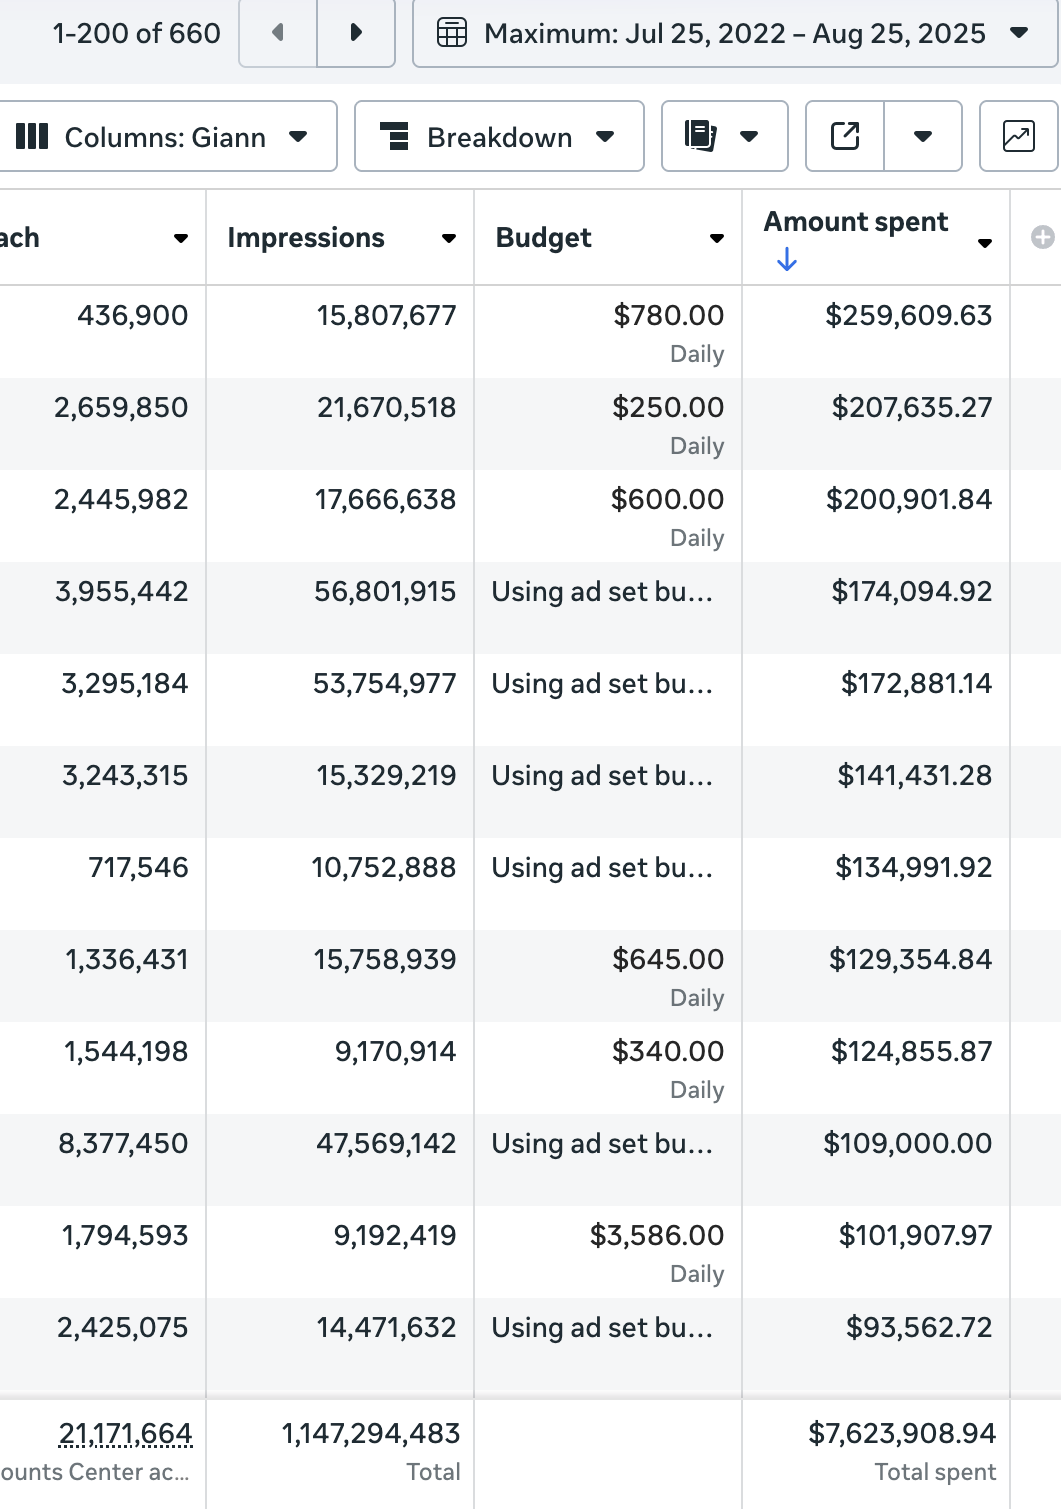
Meta Ads — $7.6M Total Spent (All-Time, 660 Campaigns)
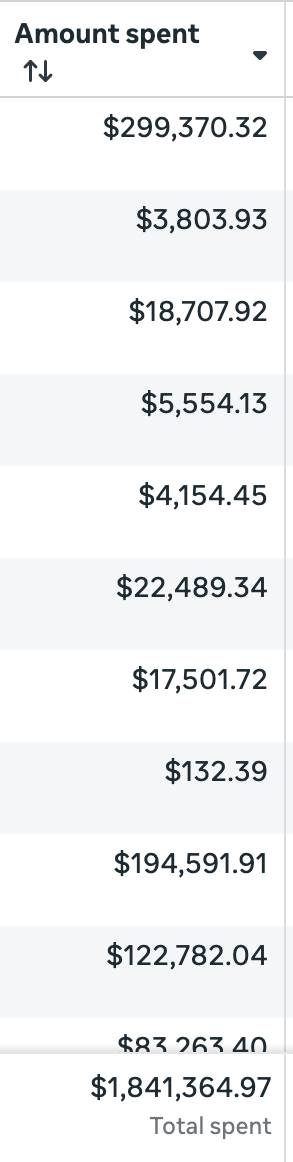
Meta Ads — $1.84M Total Spent (Another Account)
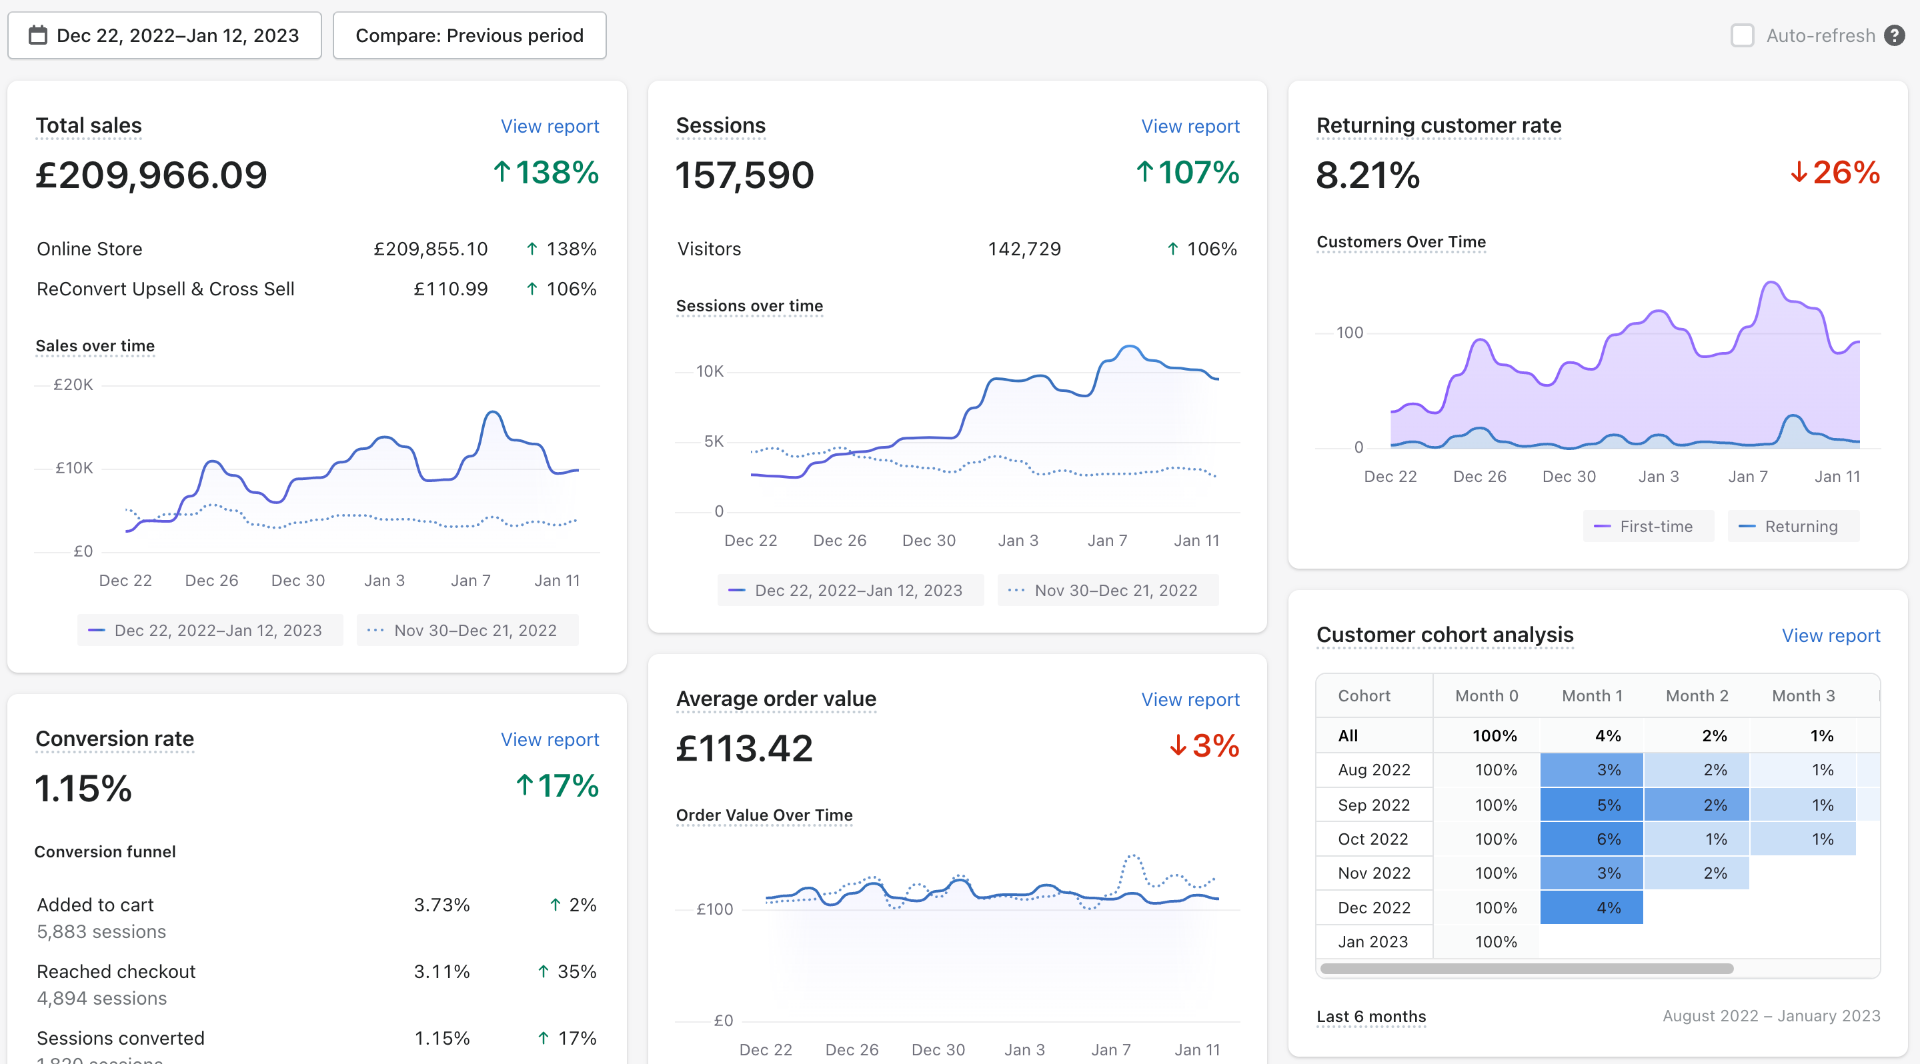
£209K Holiday Season — ↑138% (Dec 22 – Jan 12)
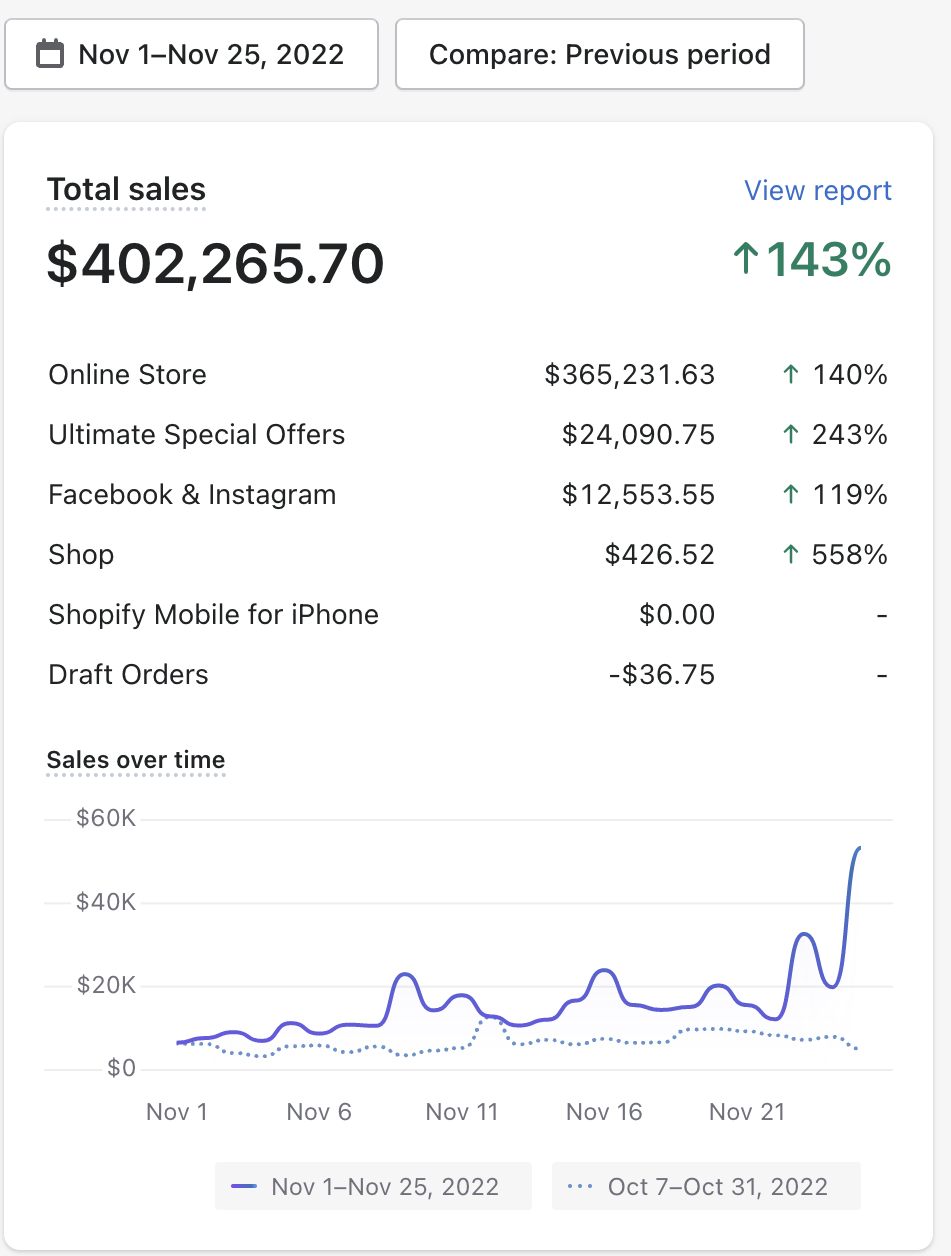
$402K November 2022 Sales — ↑143%
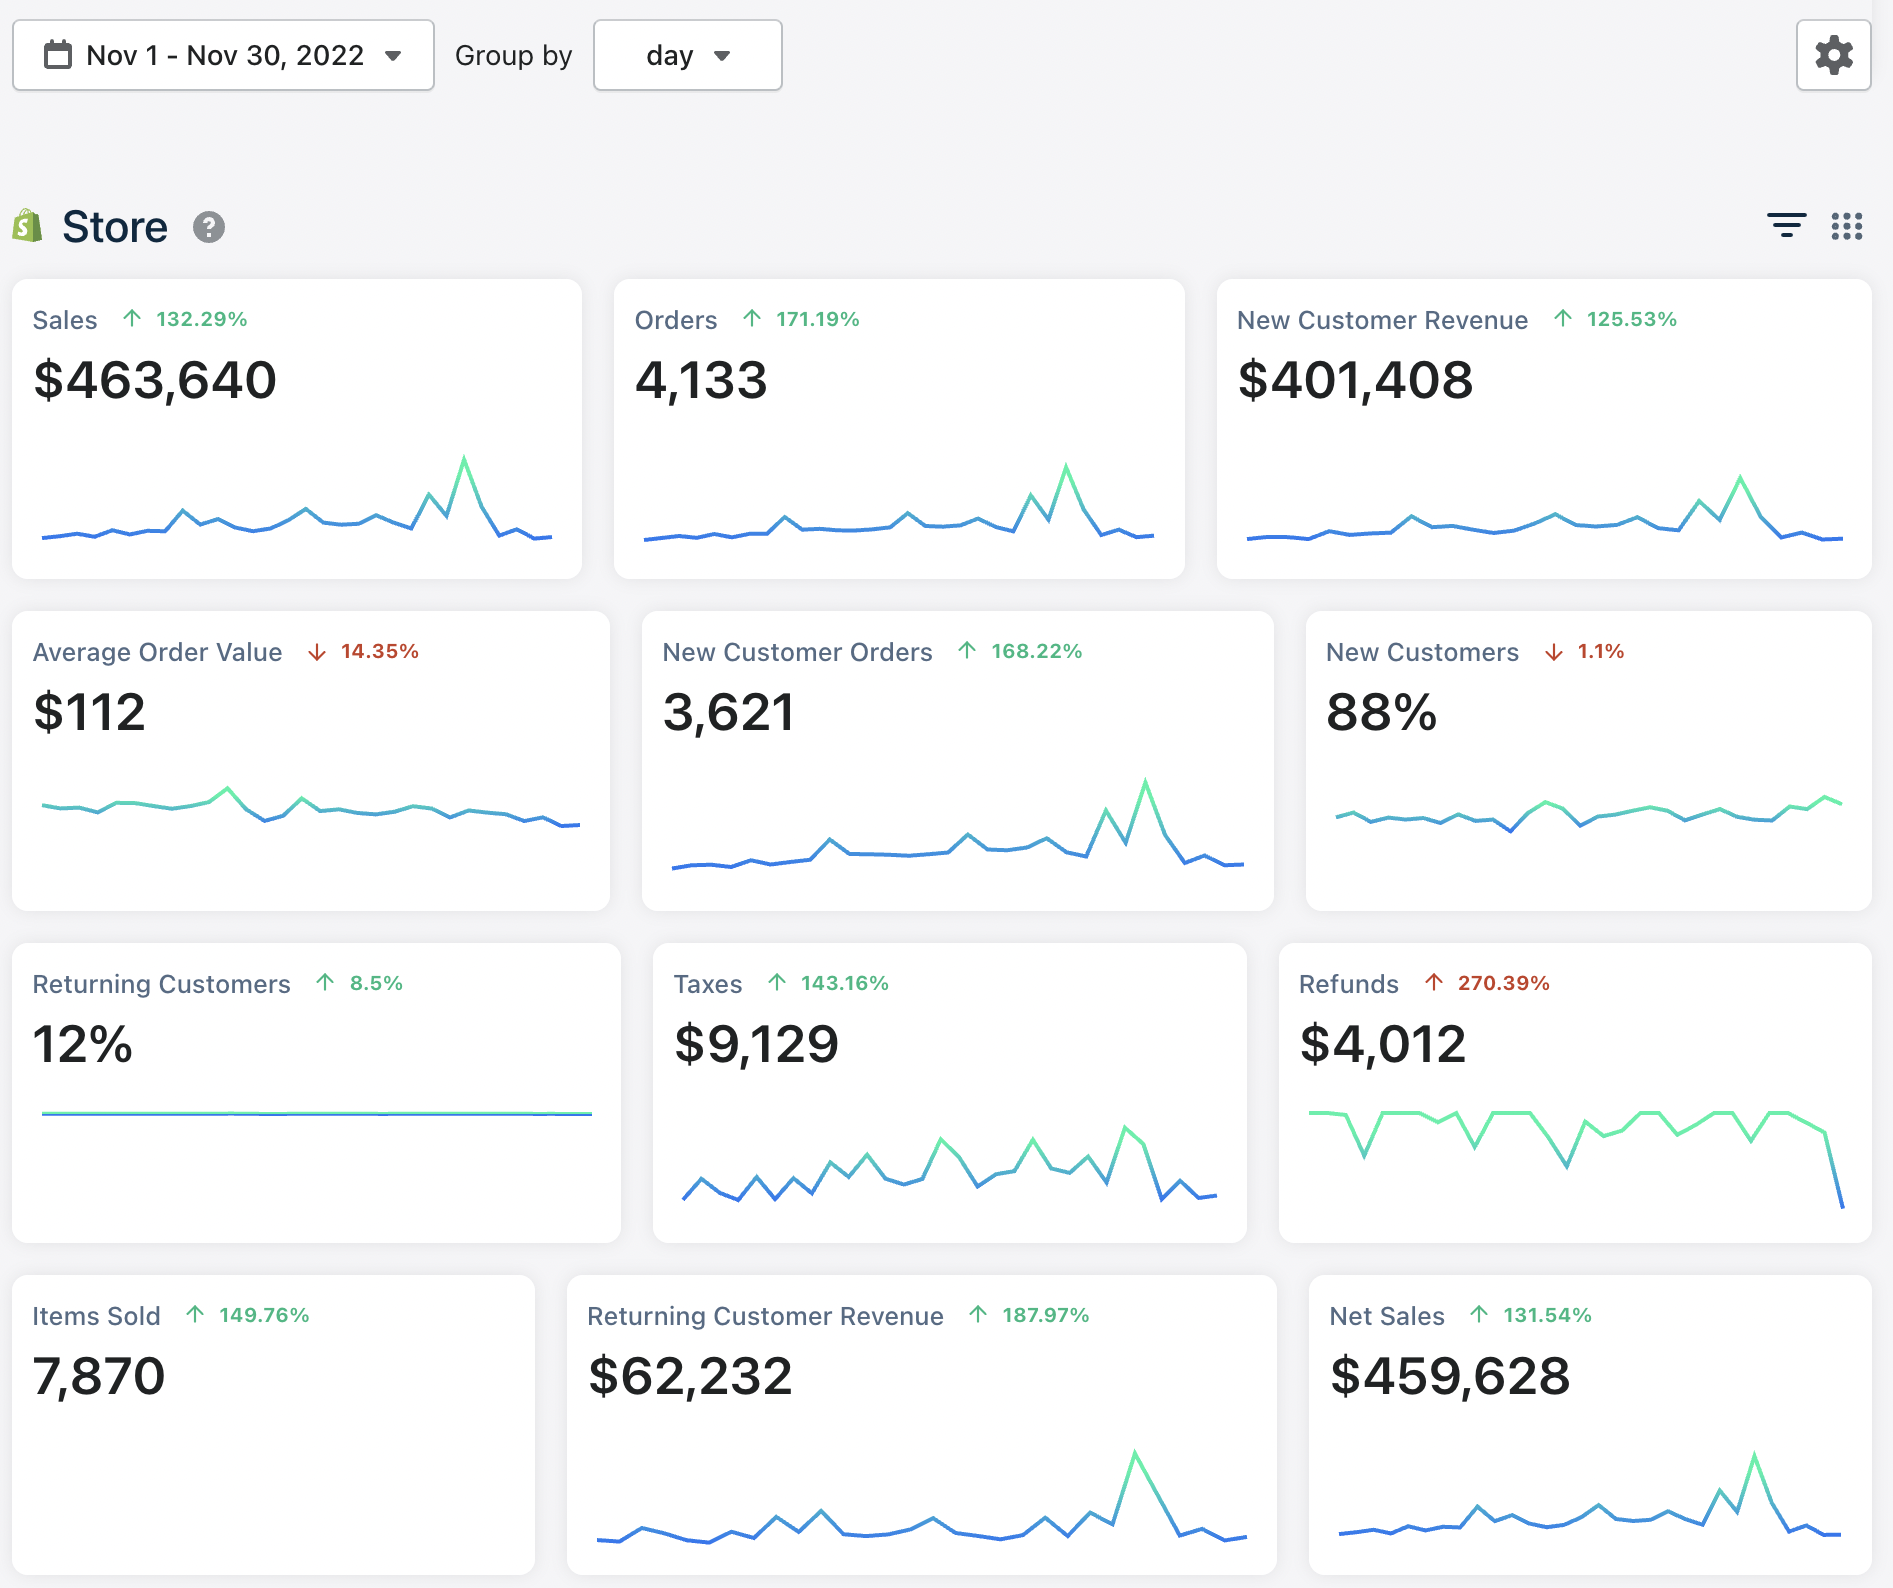
$463K November 2022 — ↑132% (Triple Whale Store)
$2.5M Spent in 12 Months (2025)
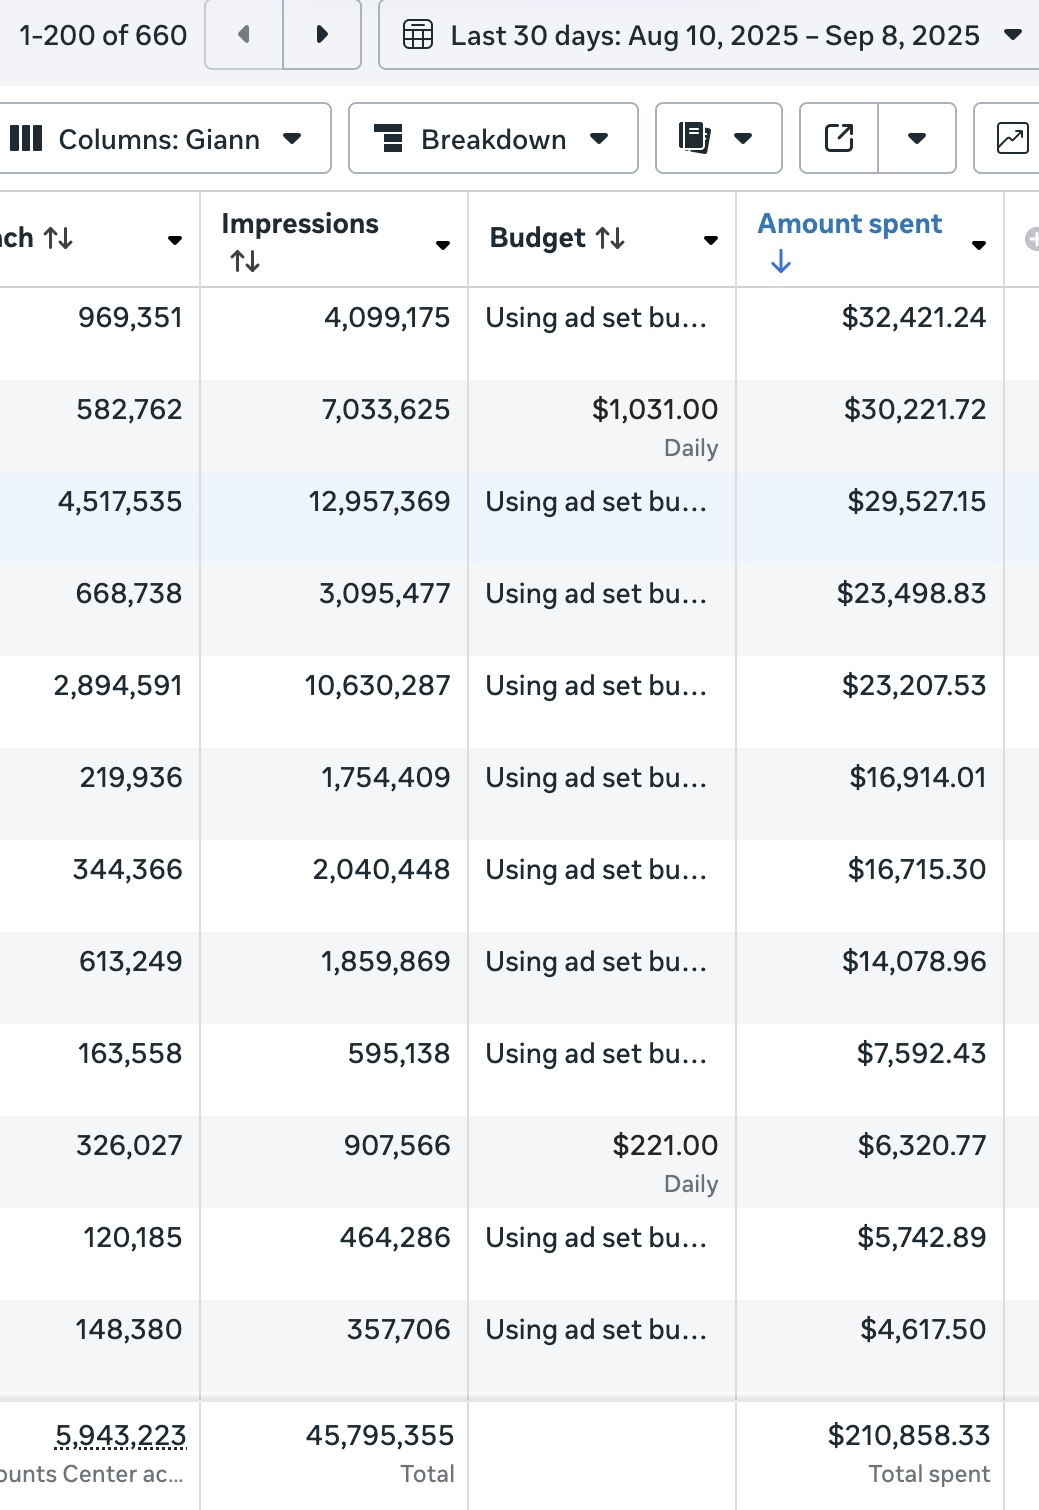
Meta Ads — $210K Spent in Last 30 Days
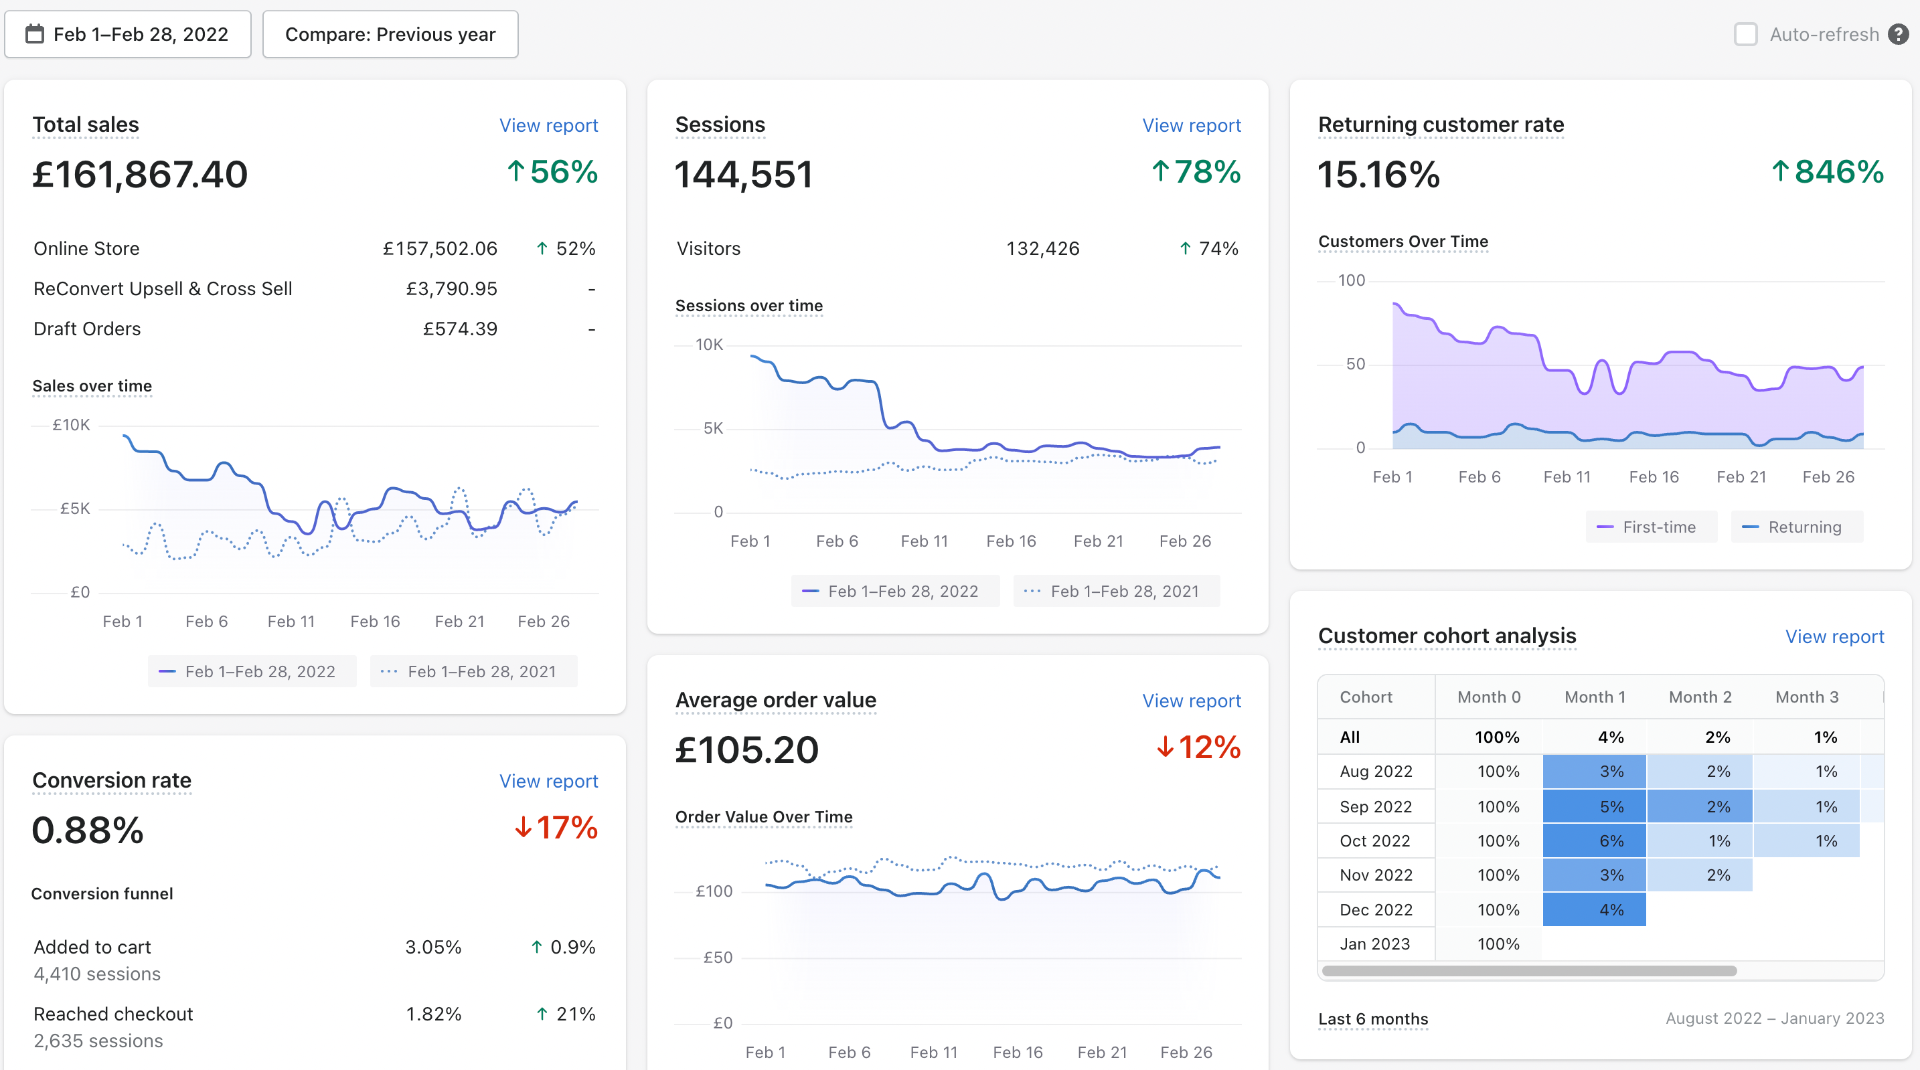
£161K February 2022 — ↑56% (846% Returning Growth)
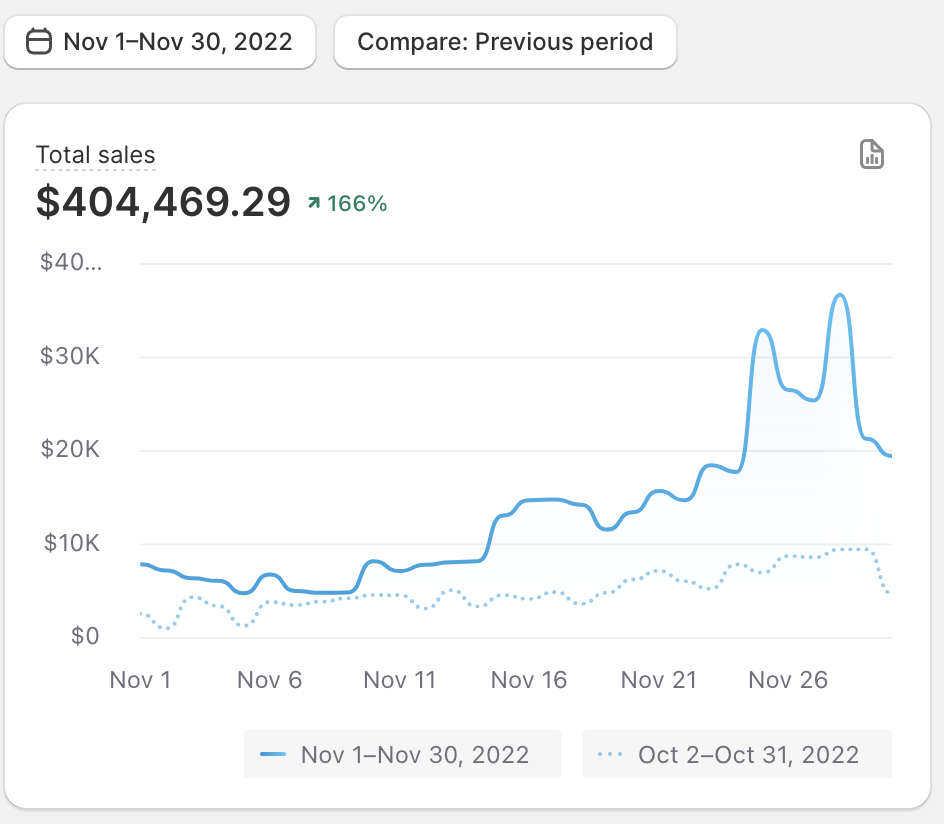
$404K Sales in November 2022 — ↑166% MoM
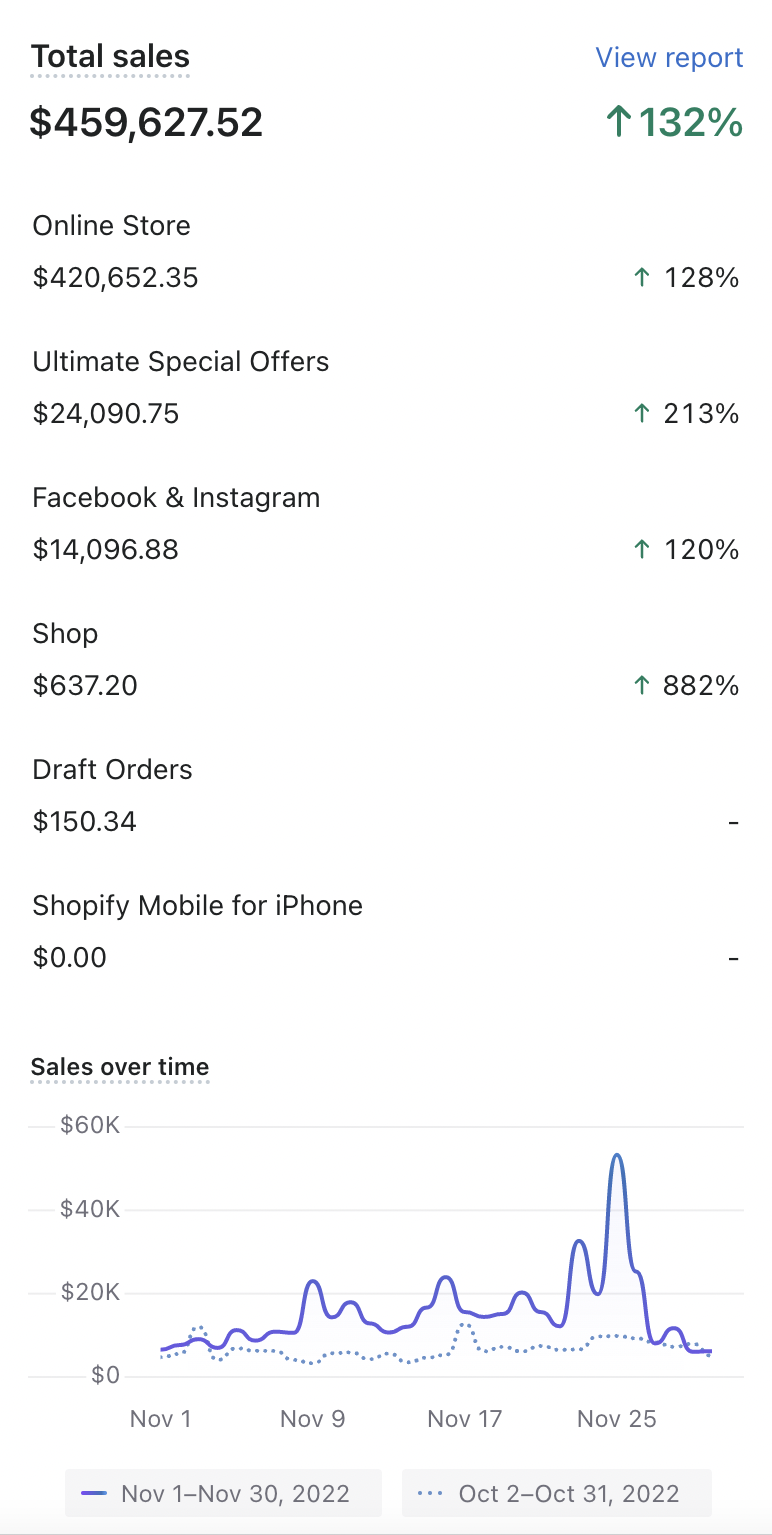
$459K November 2022 — ↑132% (Mobile View)
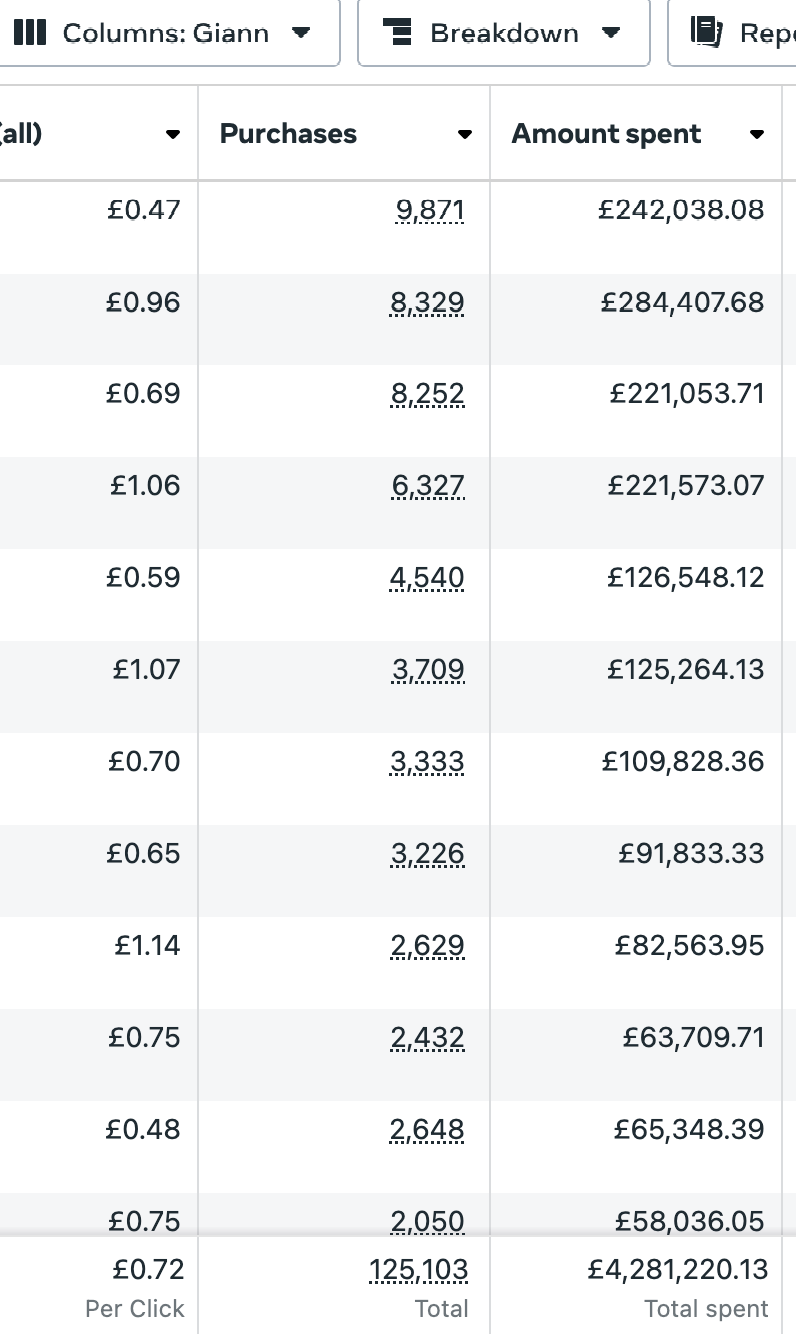
Meta Ads — £4.28M Spent, 125K Purchases (GBP Account)
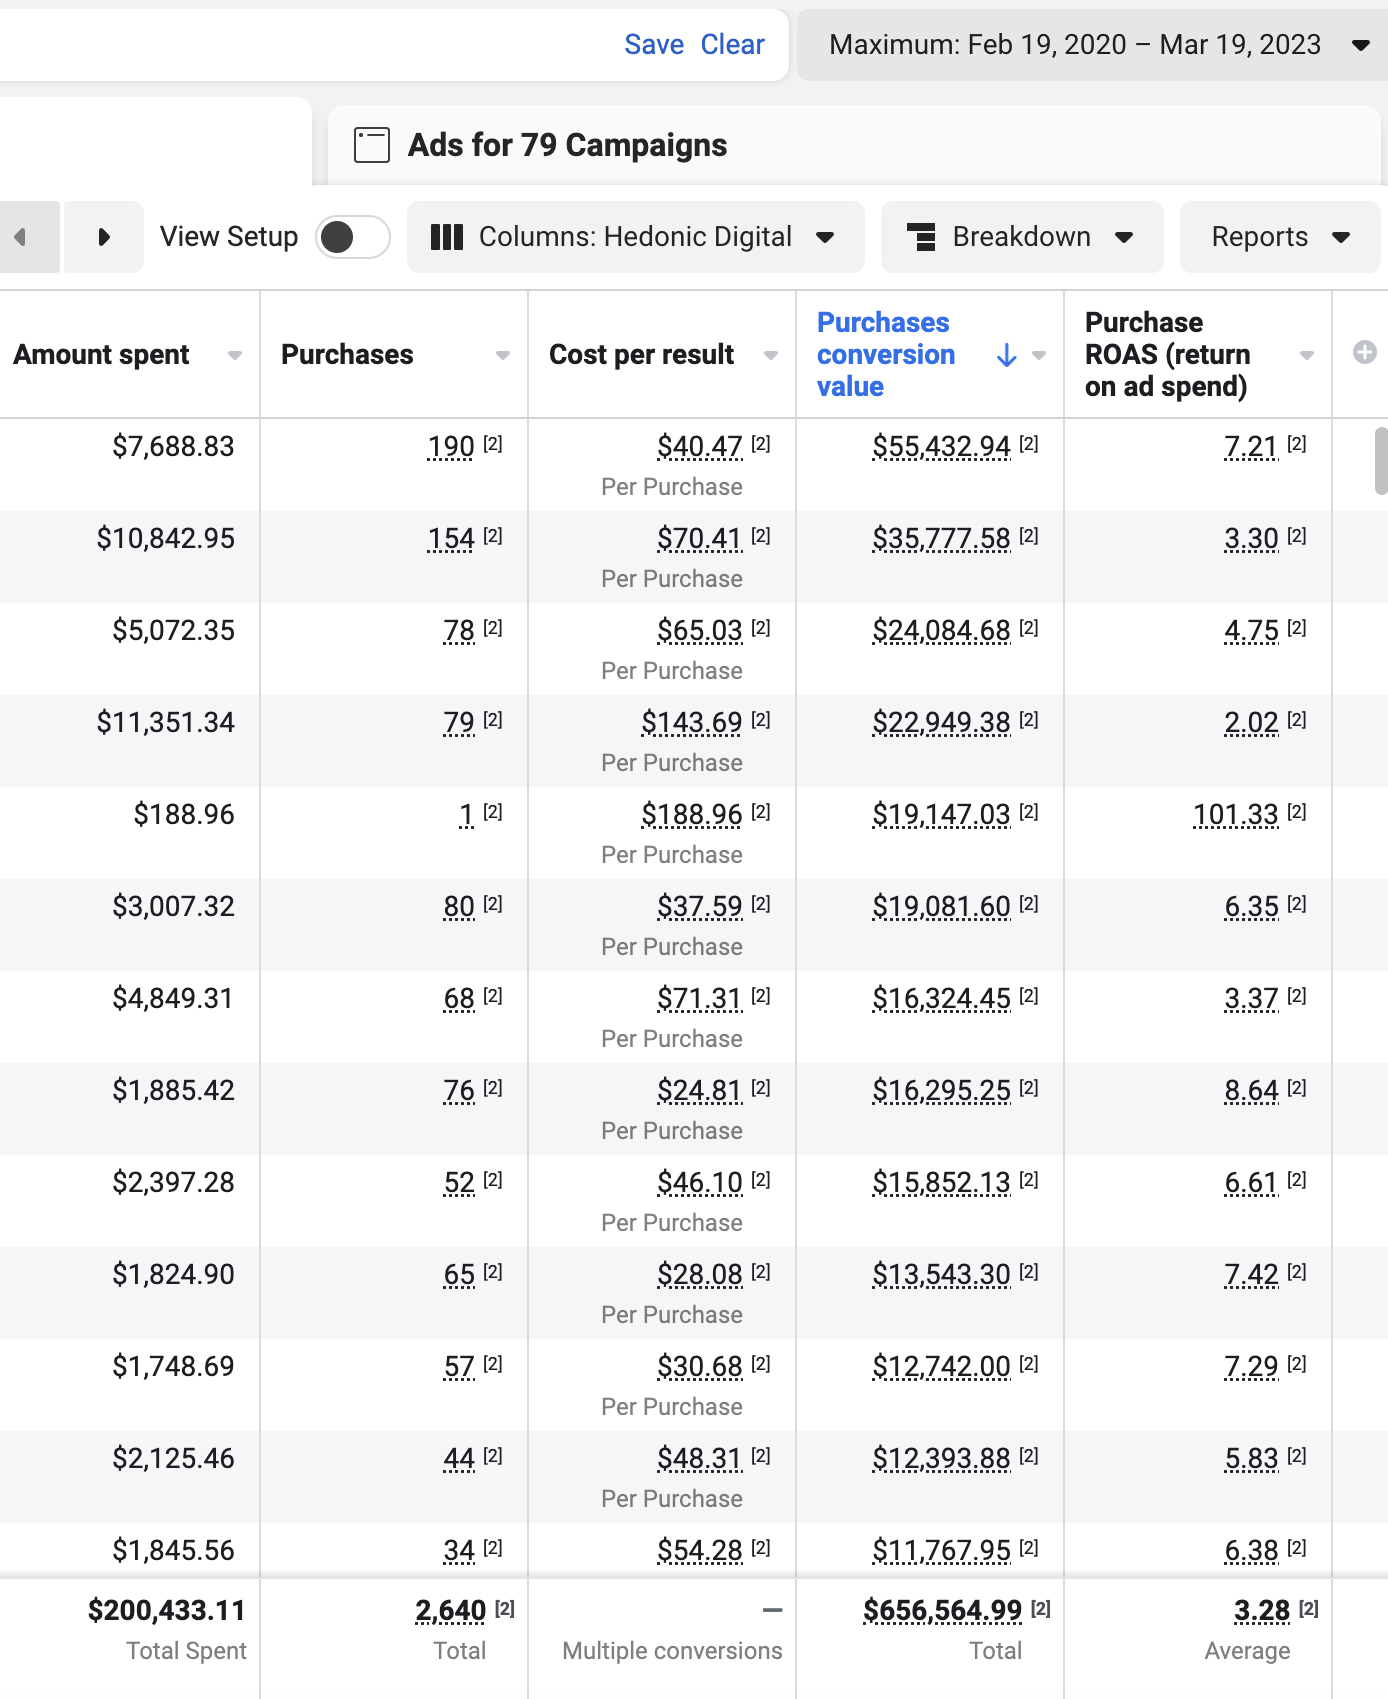
$656K Revenue from $200K Spend — 3.28x ROAS (Lifetime)
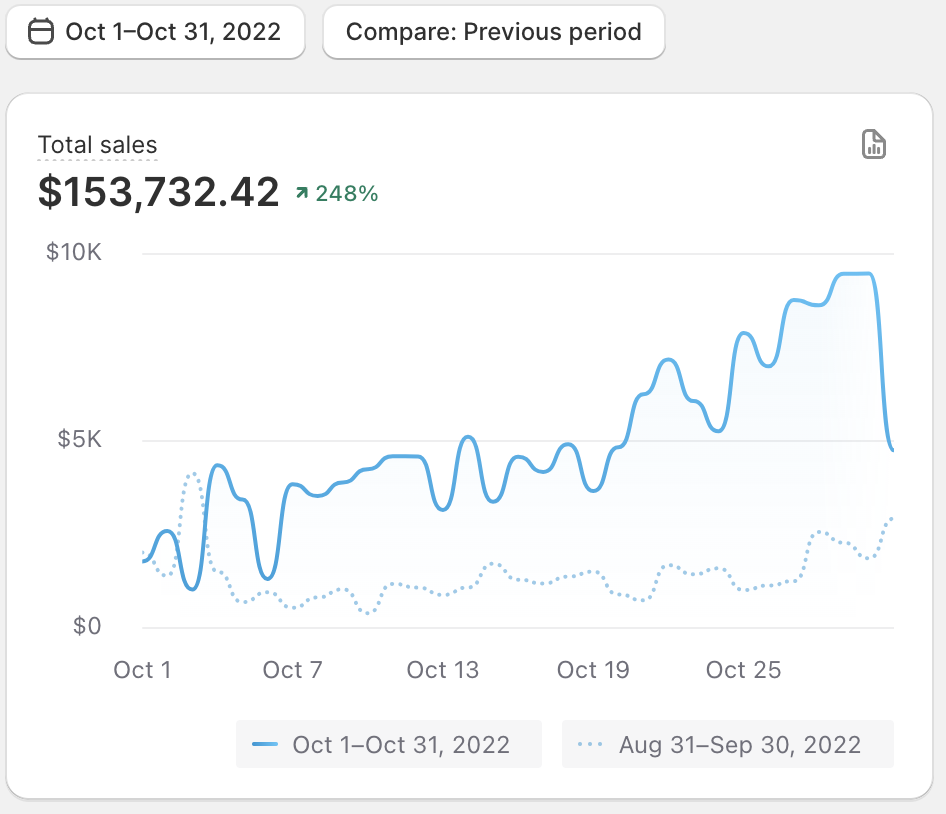
$153K Sales in October 2022 — ↑248% MoM
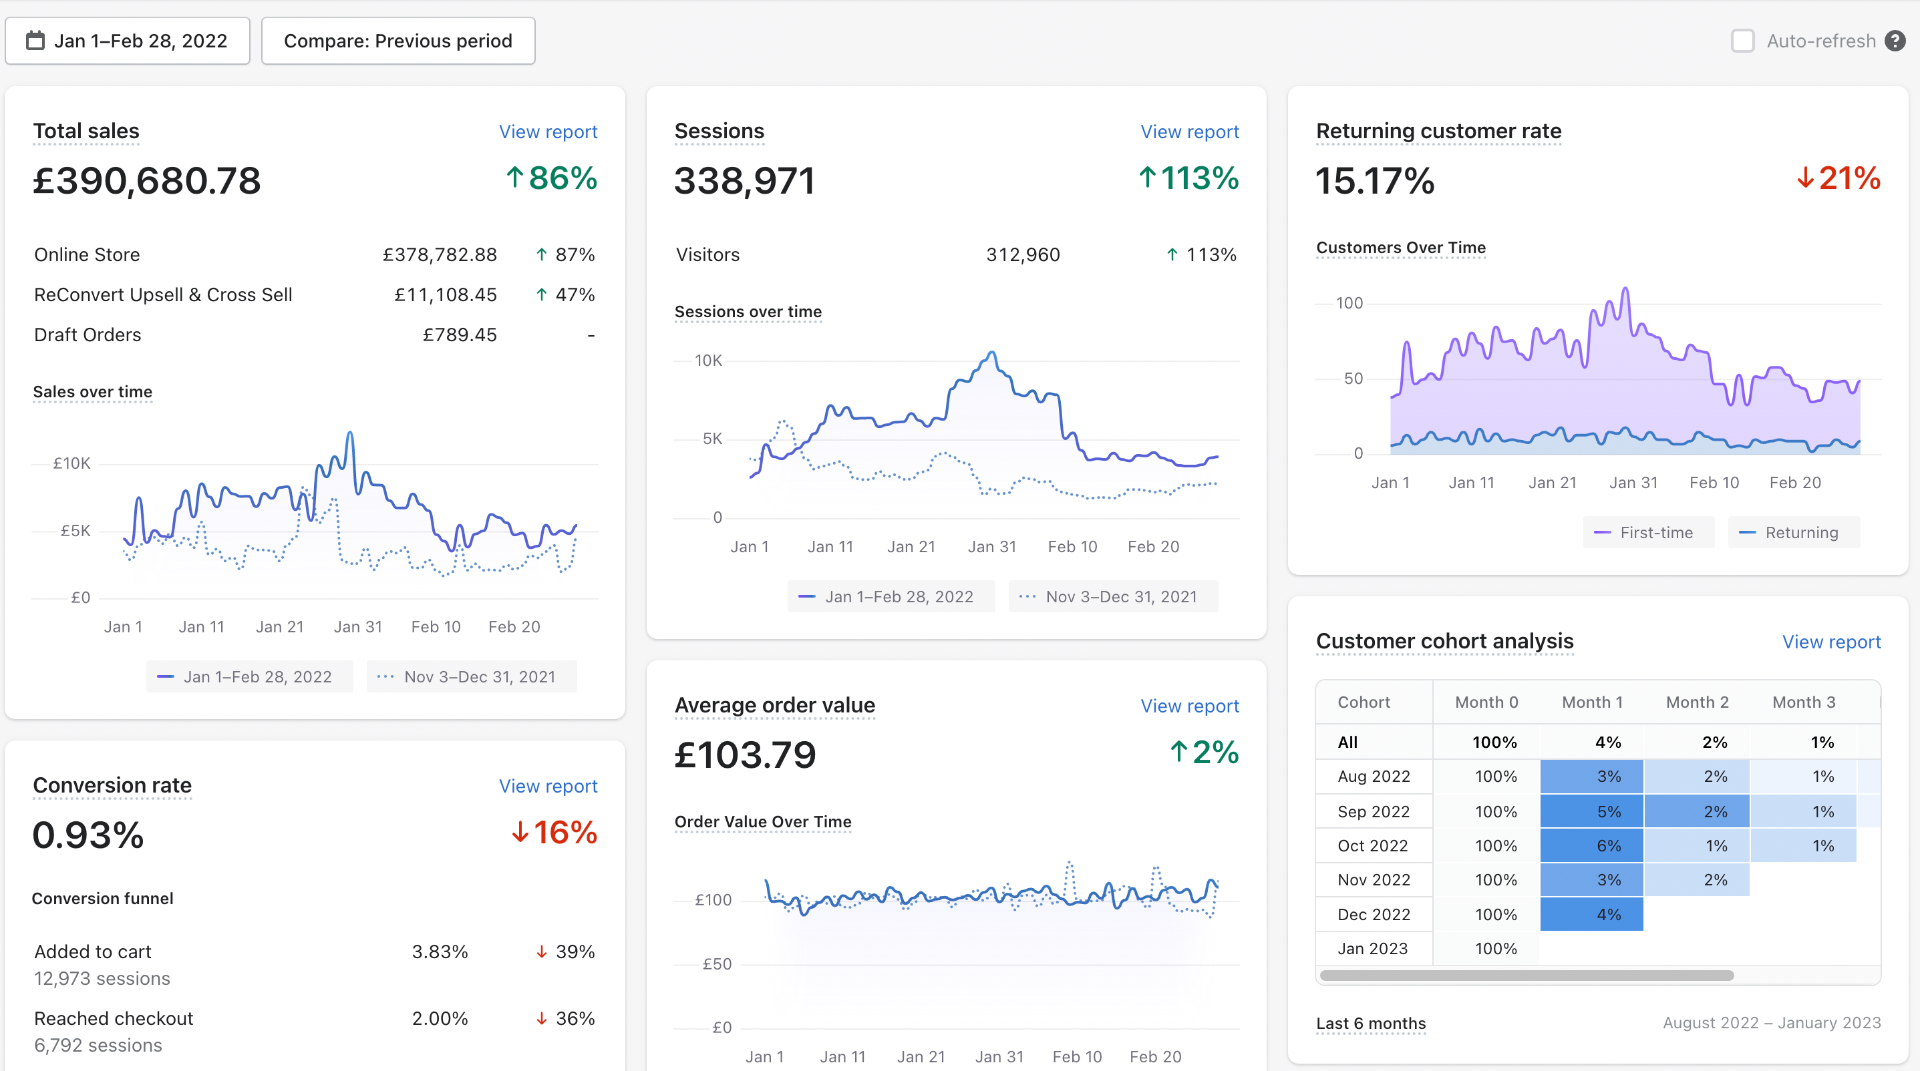
£390K Jan–Feb 2022 — ↑86% (338K Sessions)
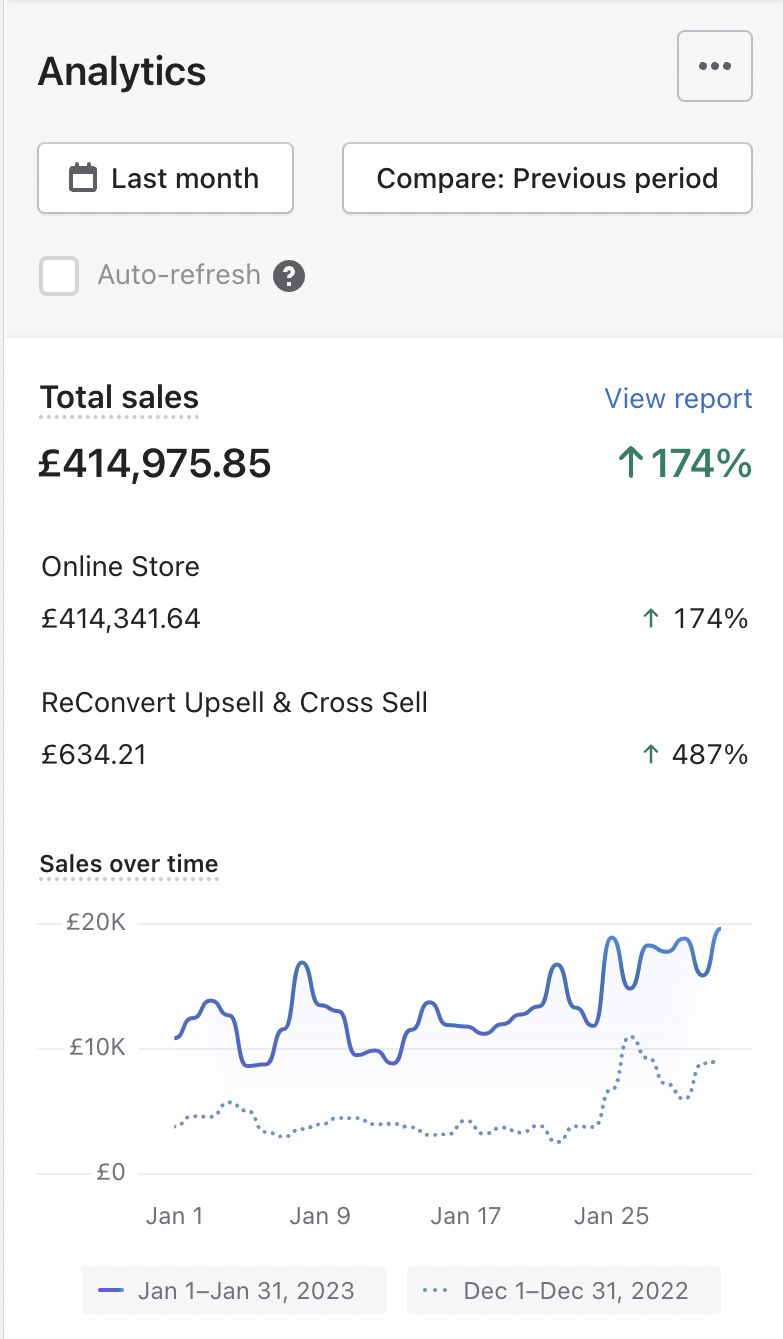
£414K January 2023 — ↑174% (Mobile View)
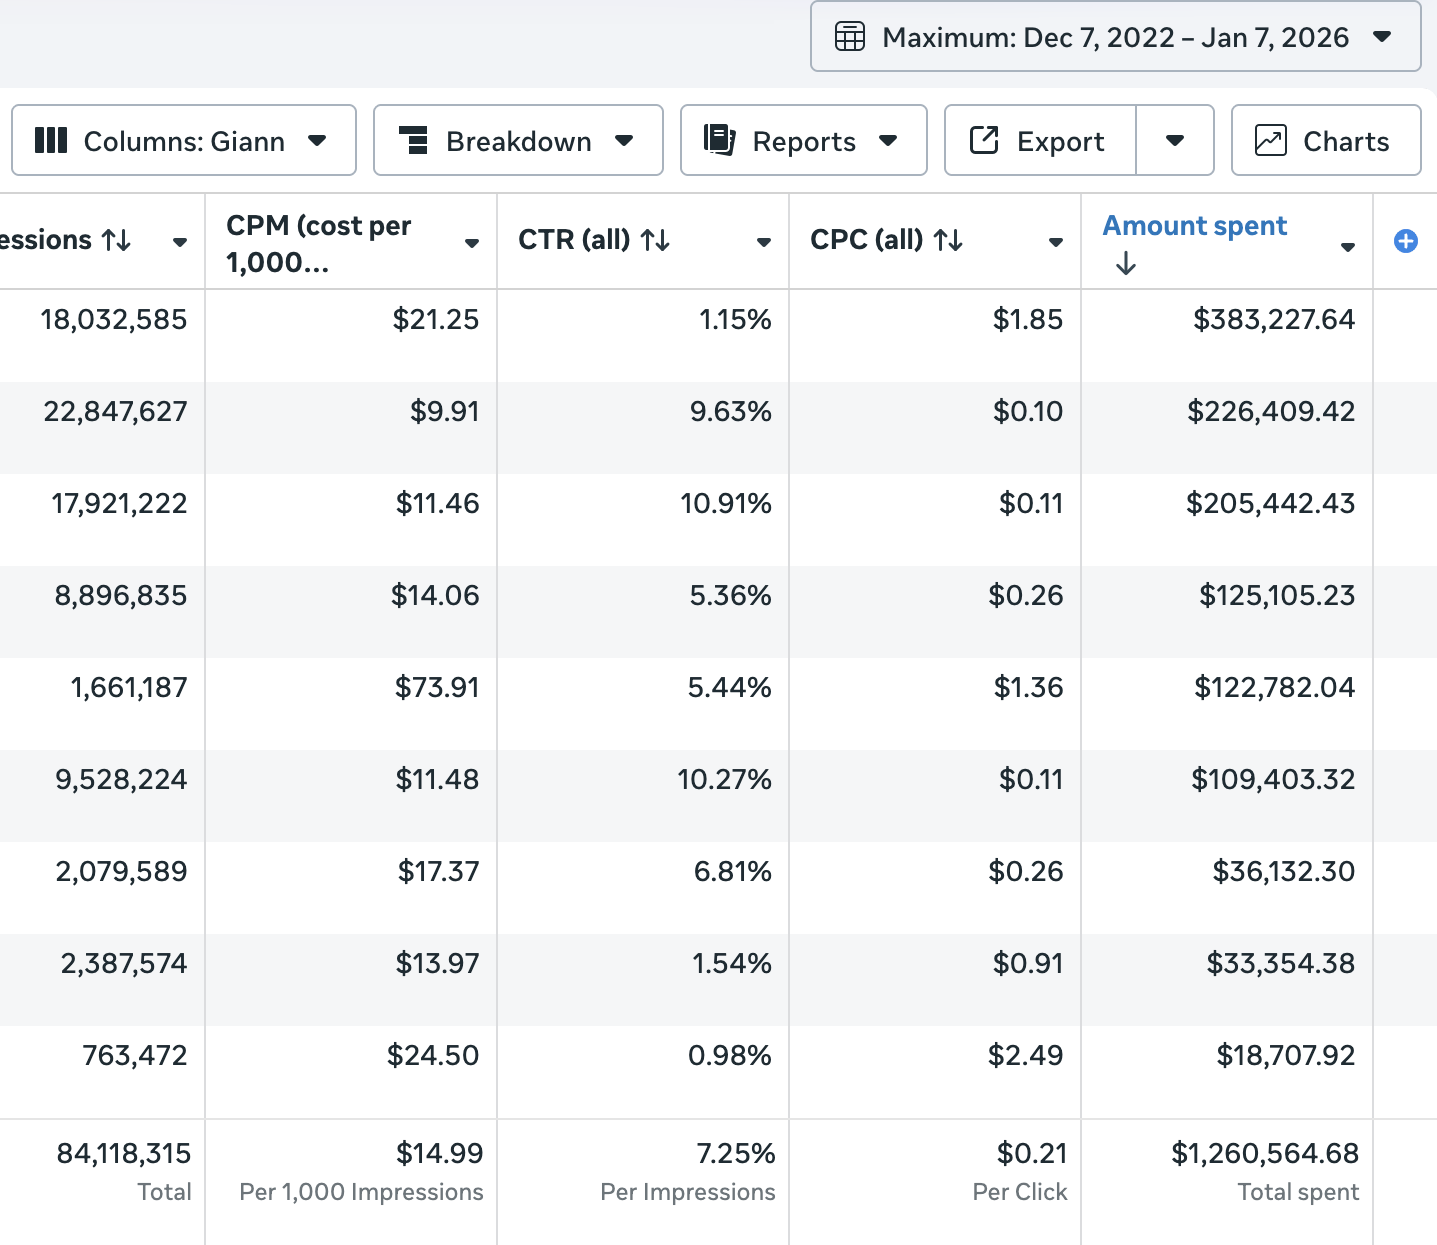
$1.26M Spent — 7.25% CTR
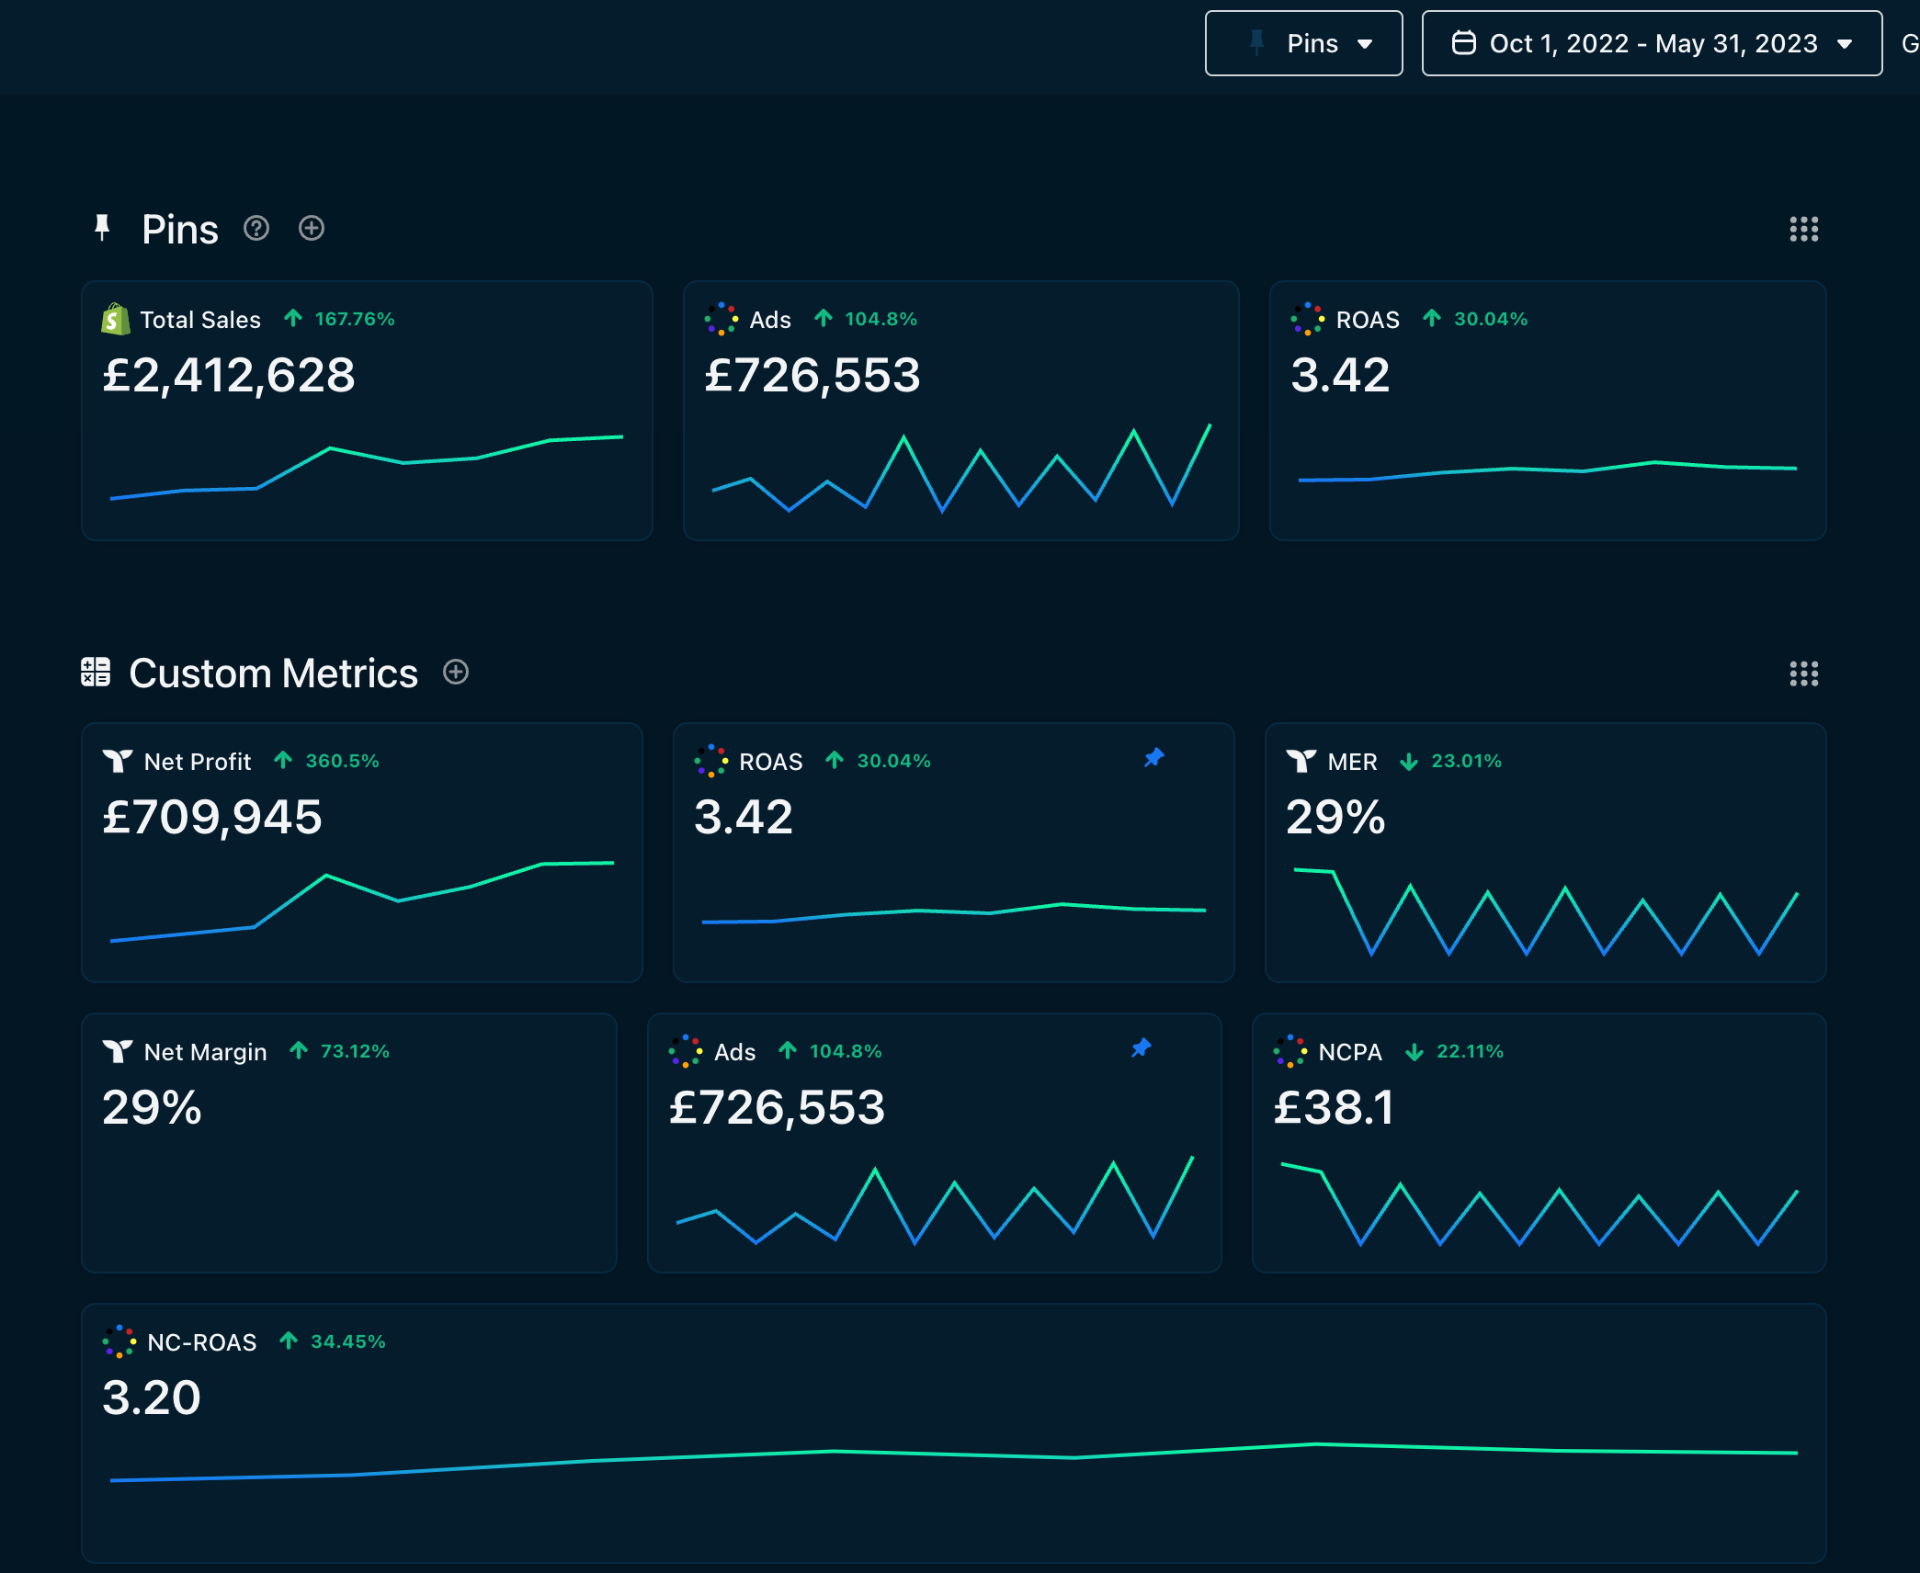
£2.4M Total Sales — 3.42 ROAS Dashboard
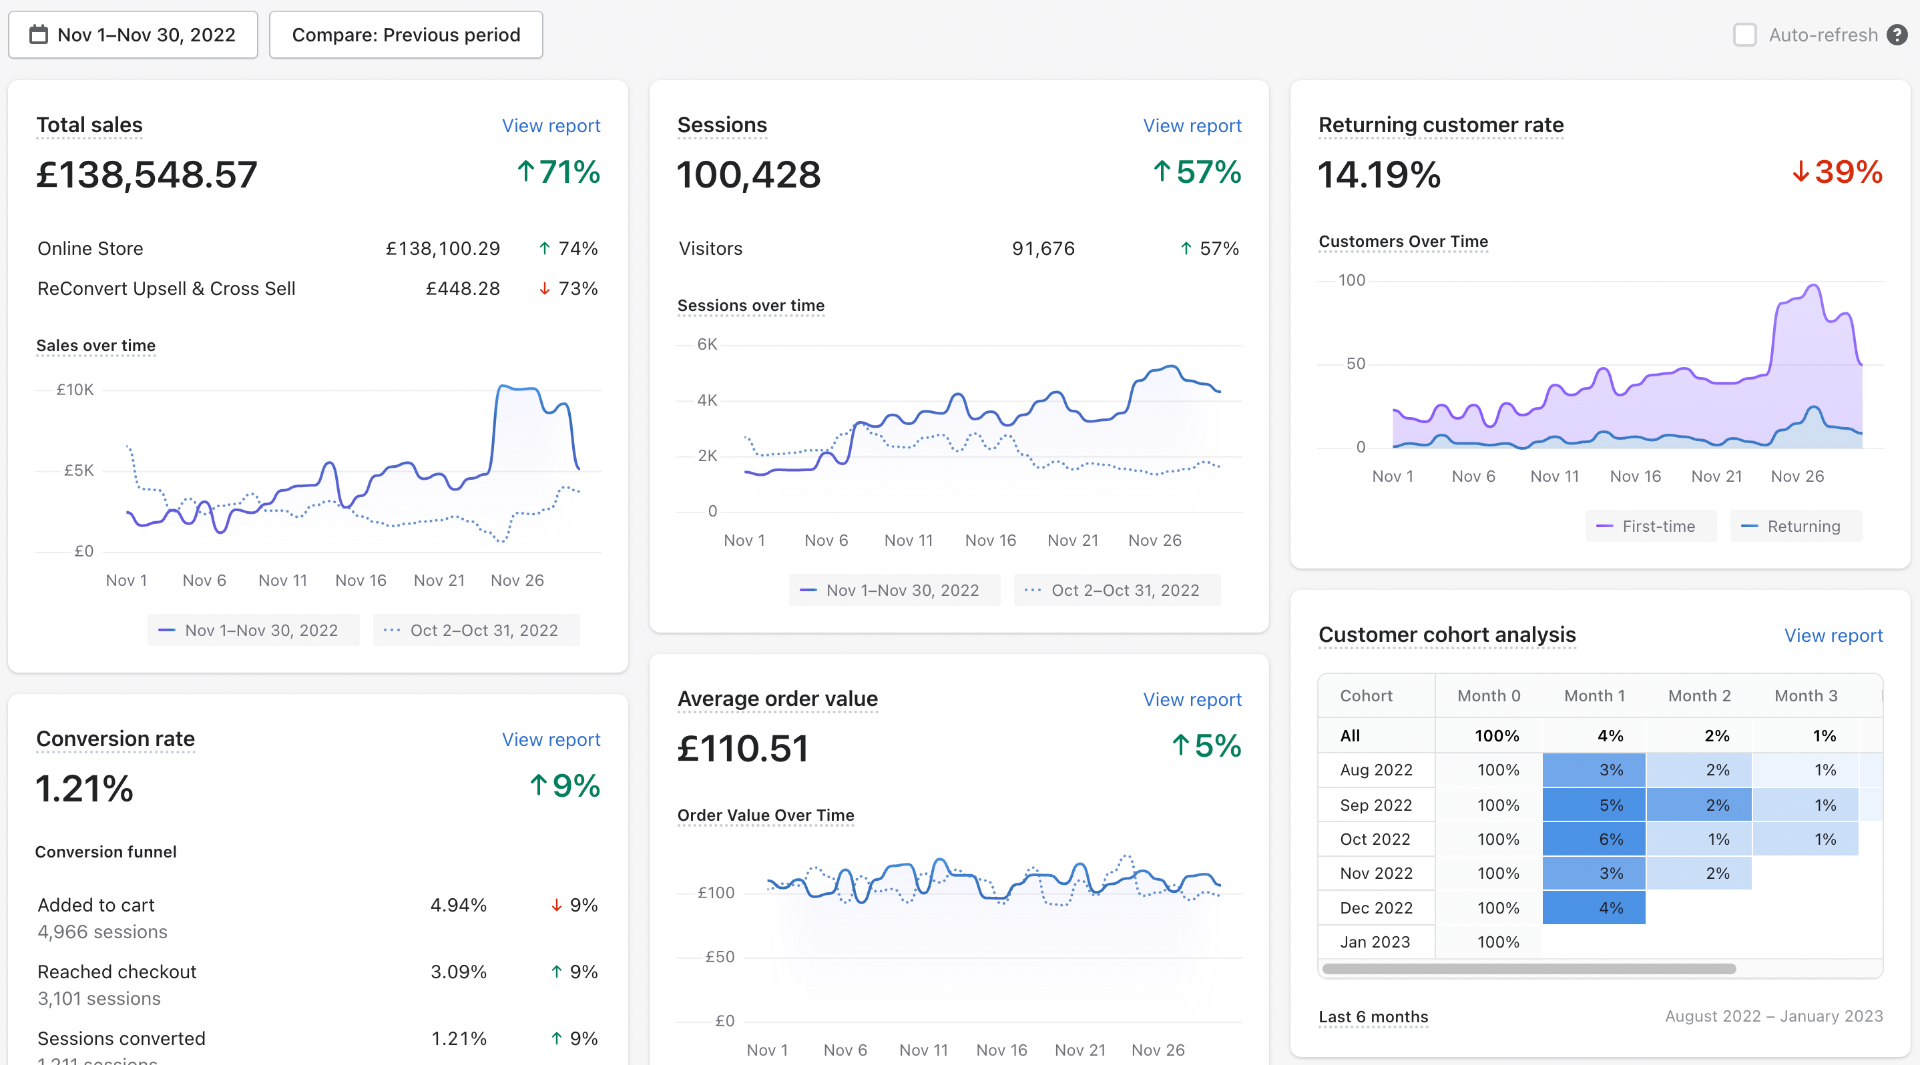
£138K November 2022 — ↑71% (100K Sessions)
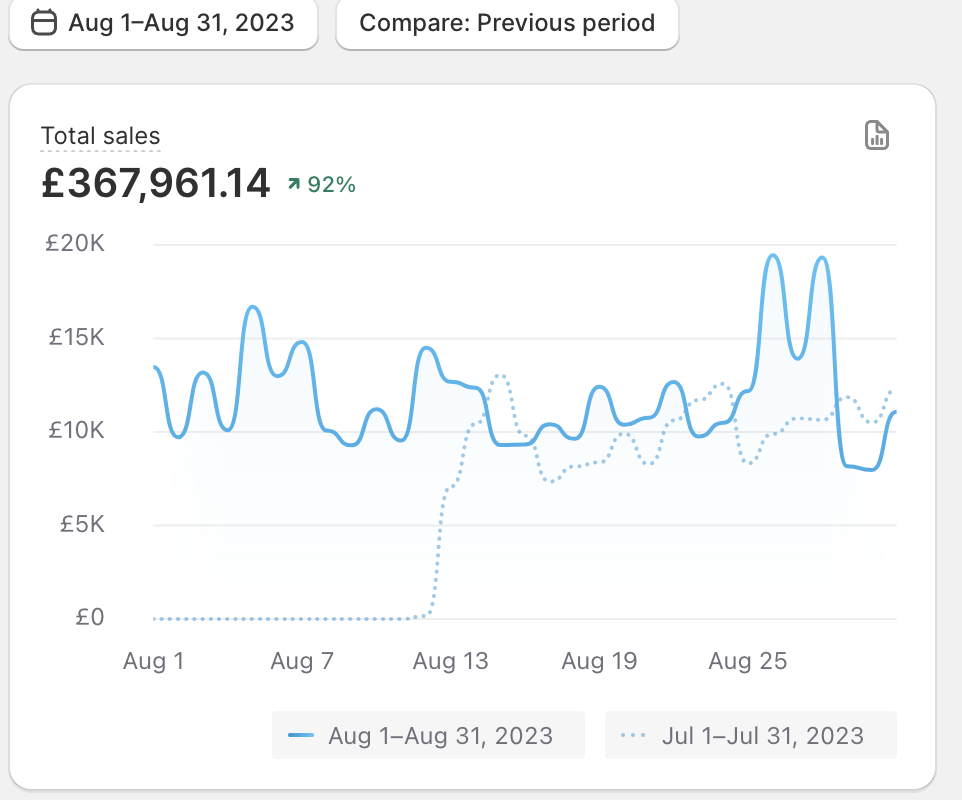
£367K August 2023 Sales — Revenue Chart
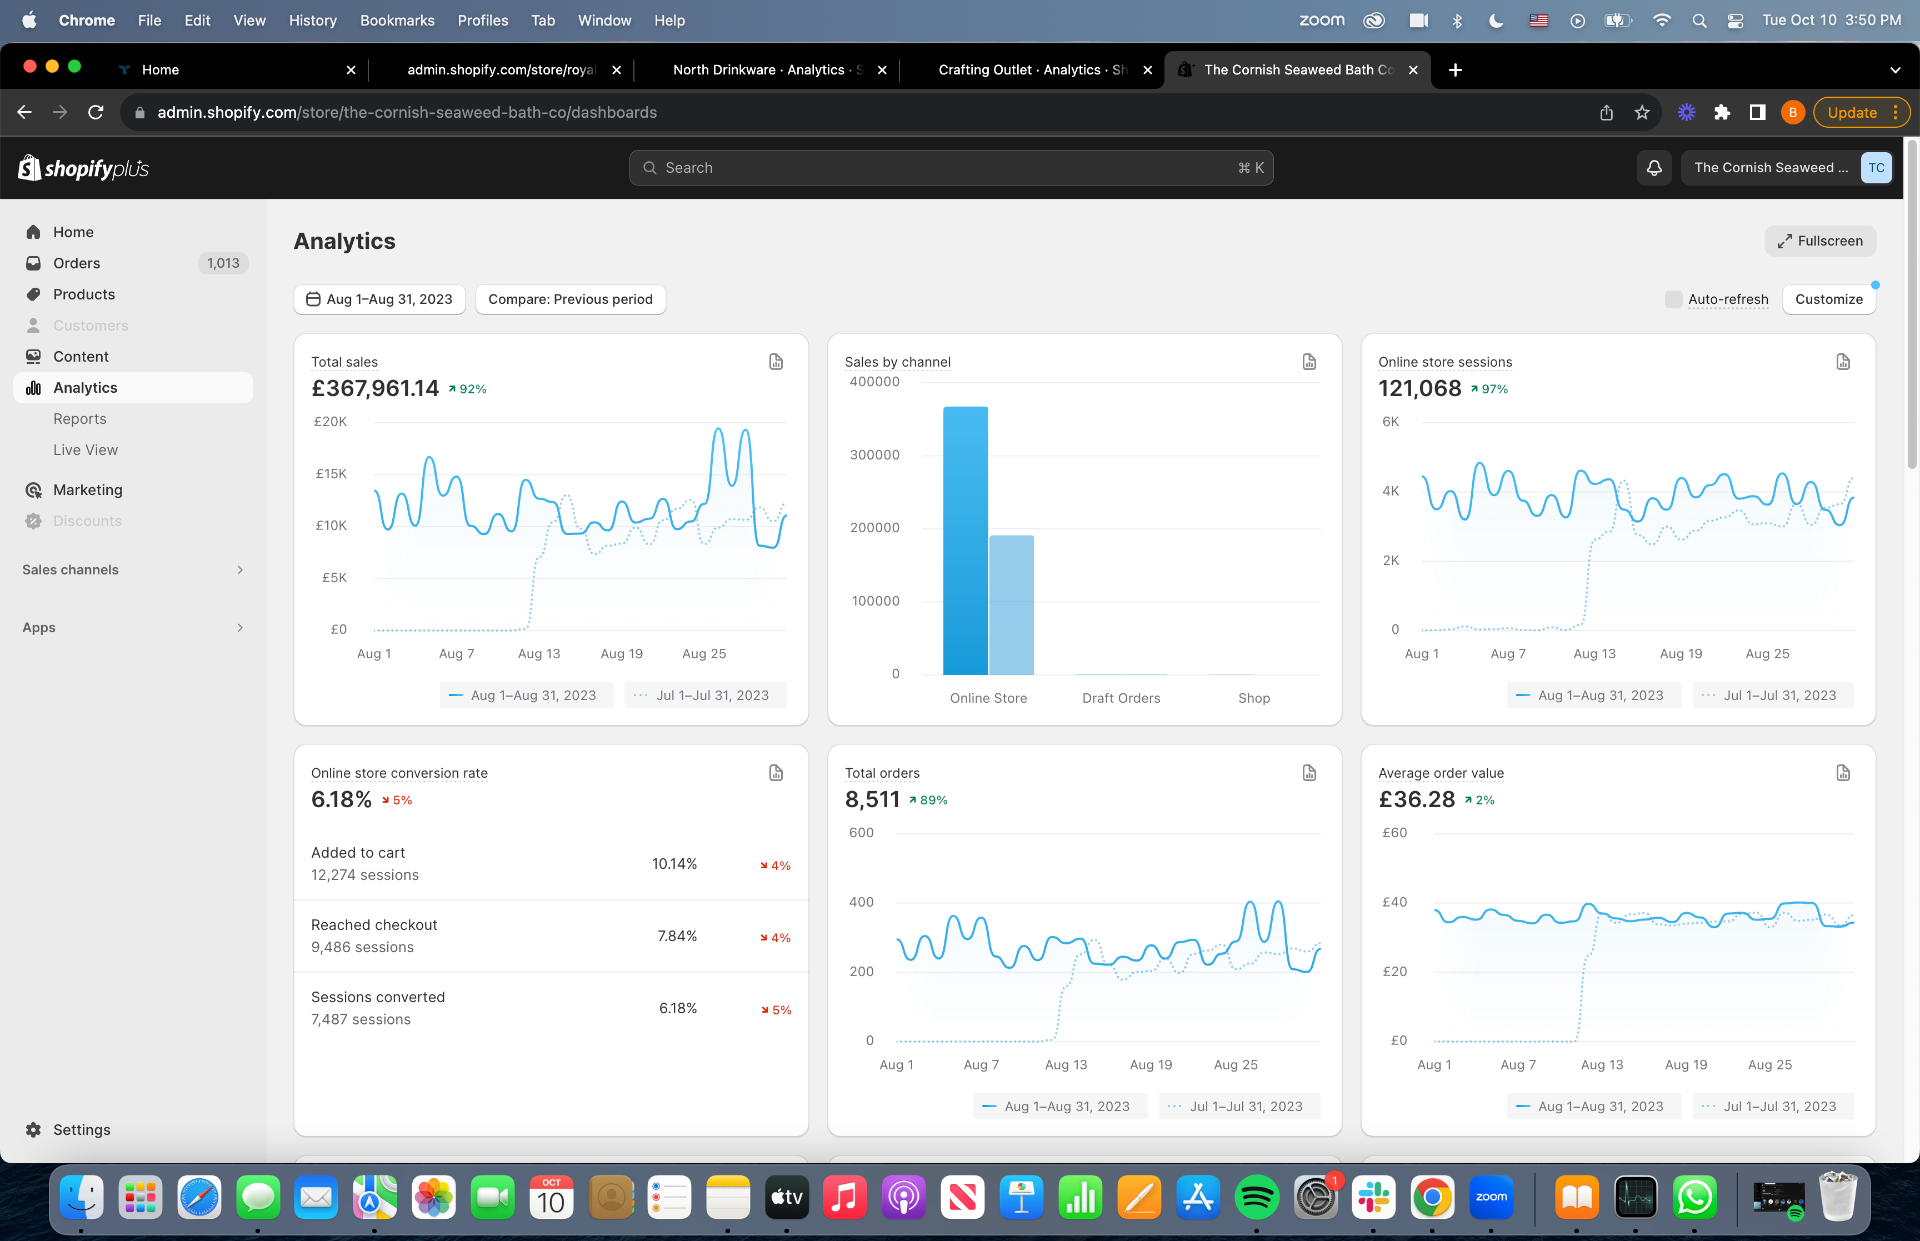
£367K Shopify Revenue in August 2023 — ↑92% MoM
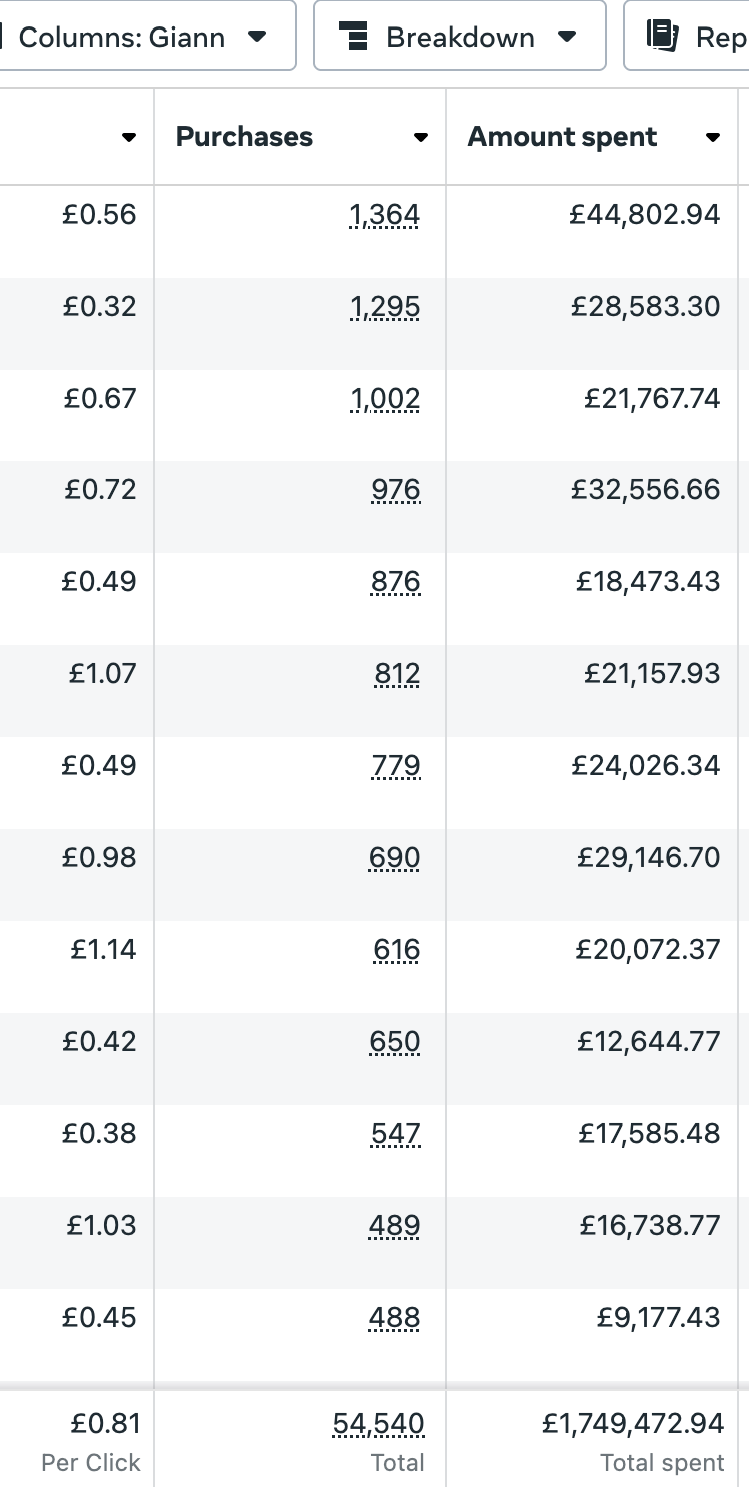
Meta Ads — £1.75M Spent, 54.5K Purchases (GBP Account)
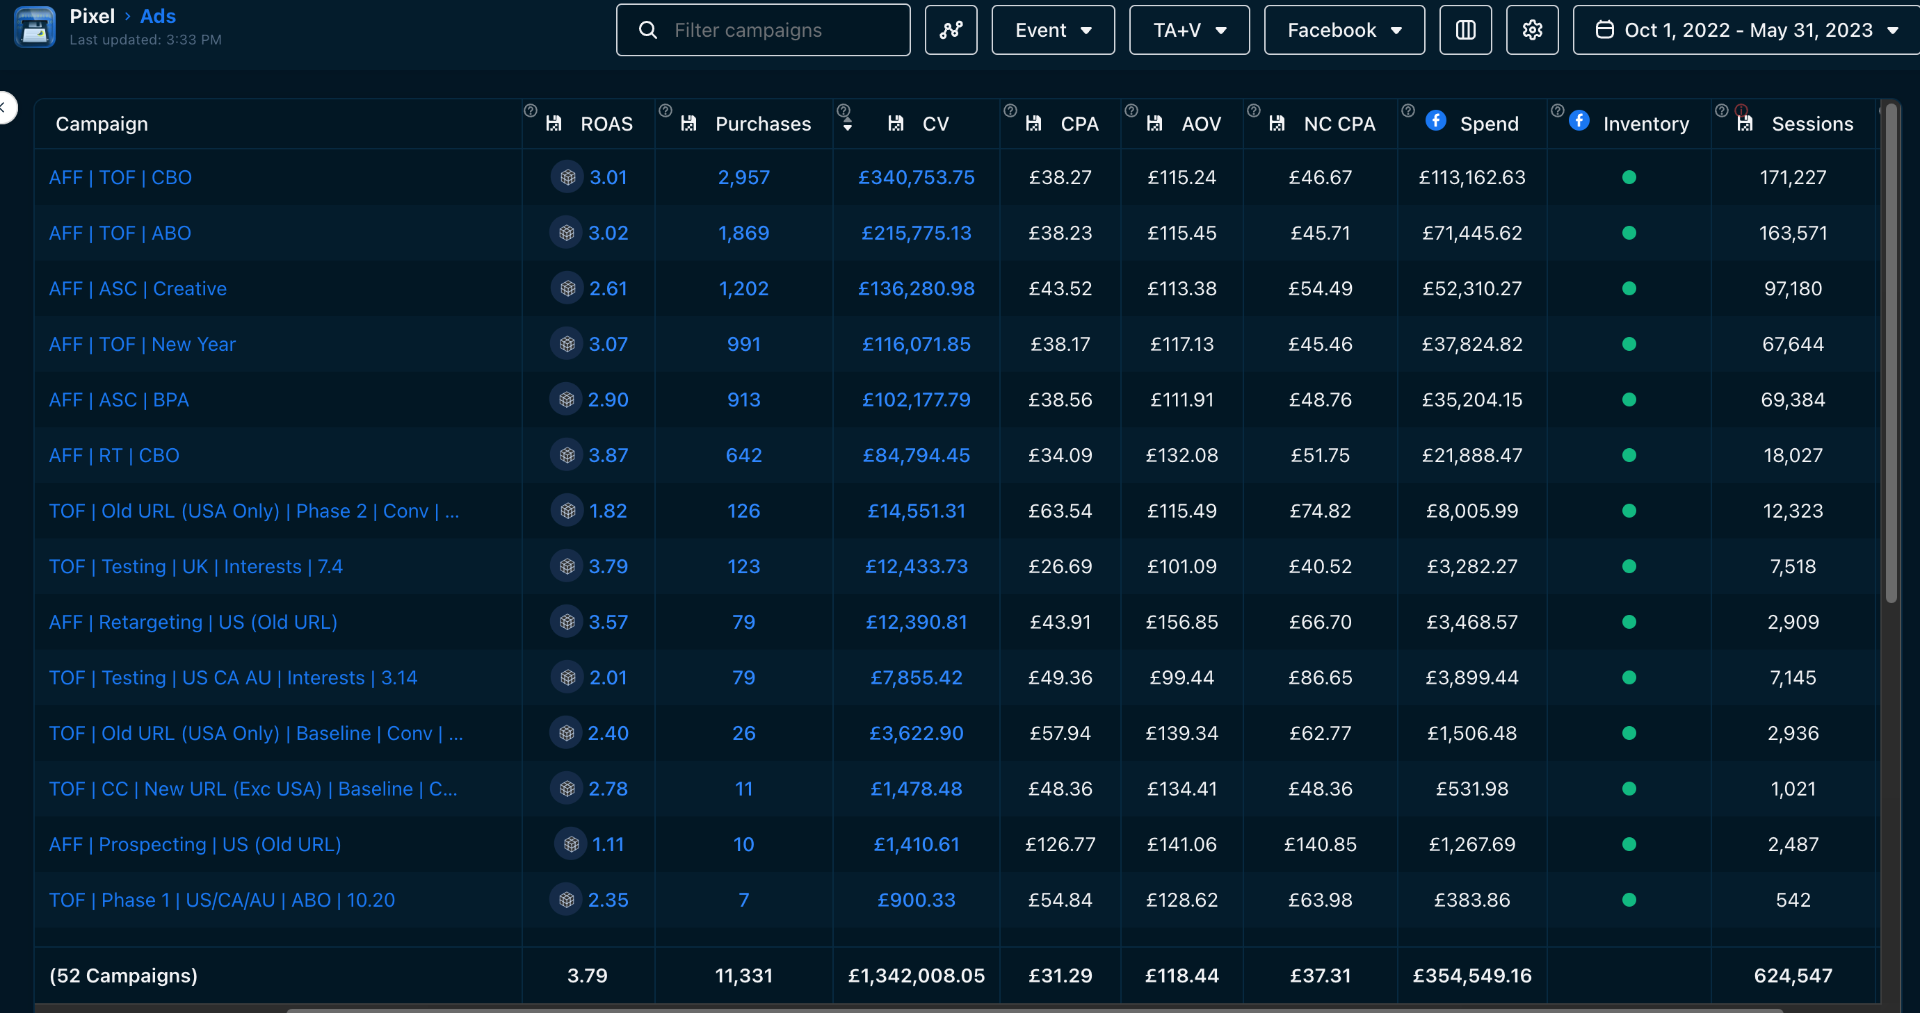
£1.34M Revenue — 3.79 ROAS (52 Campaigns)
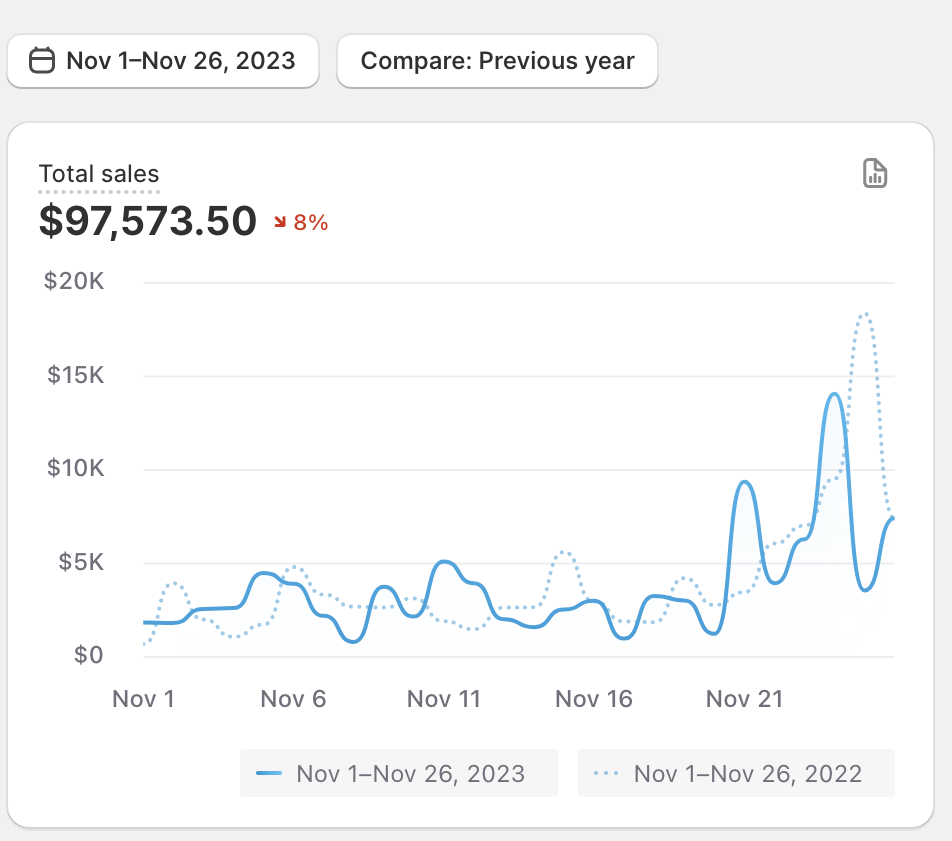
$97.5K Sales in November 2023
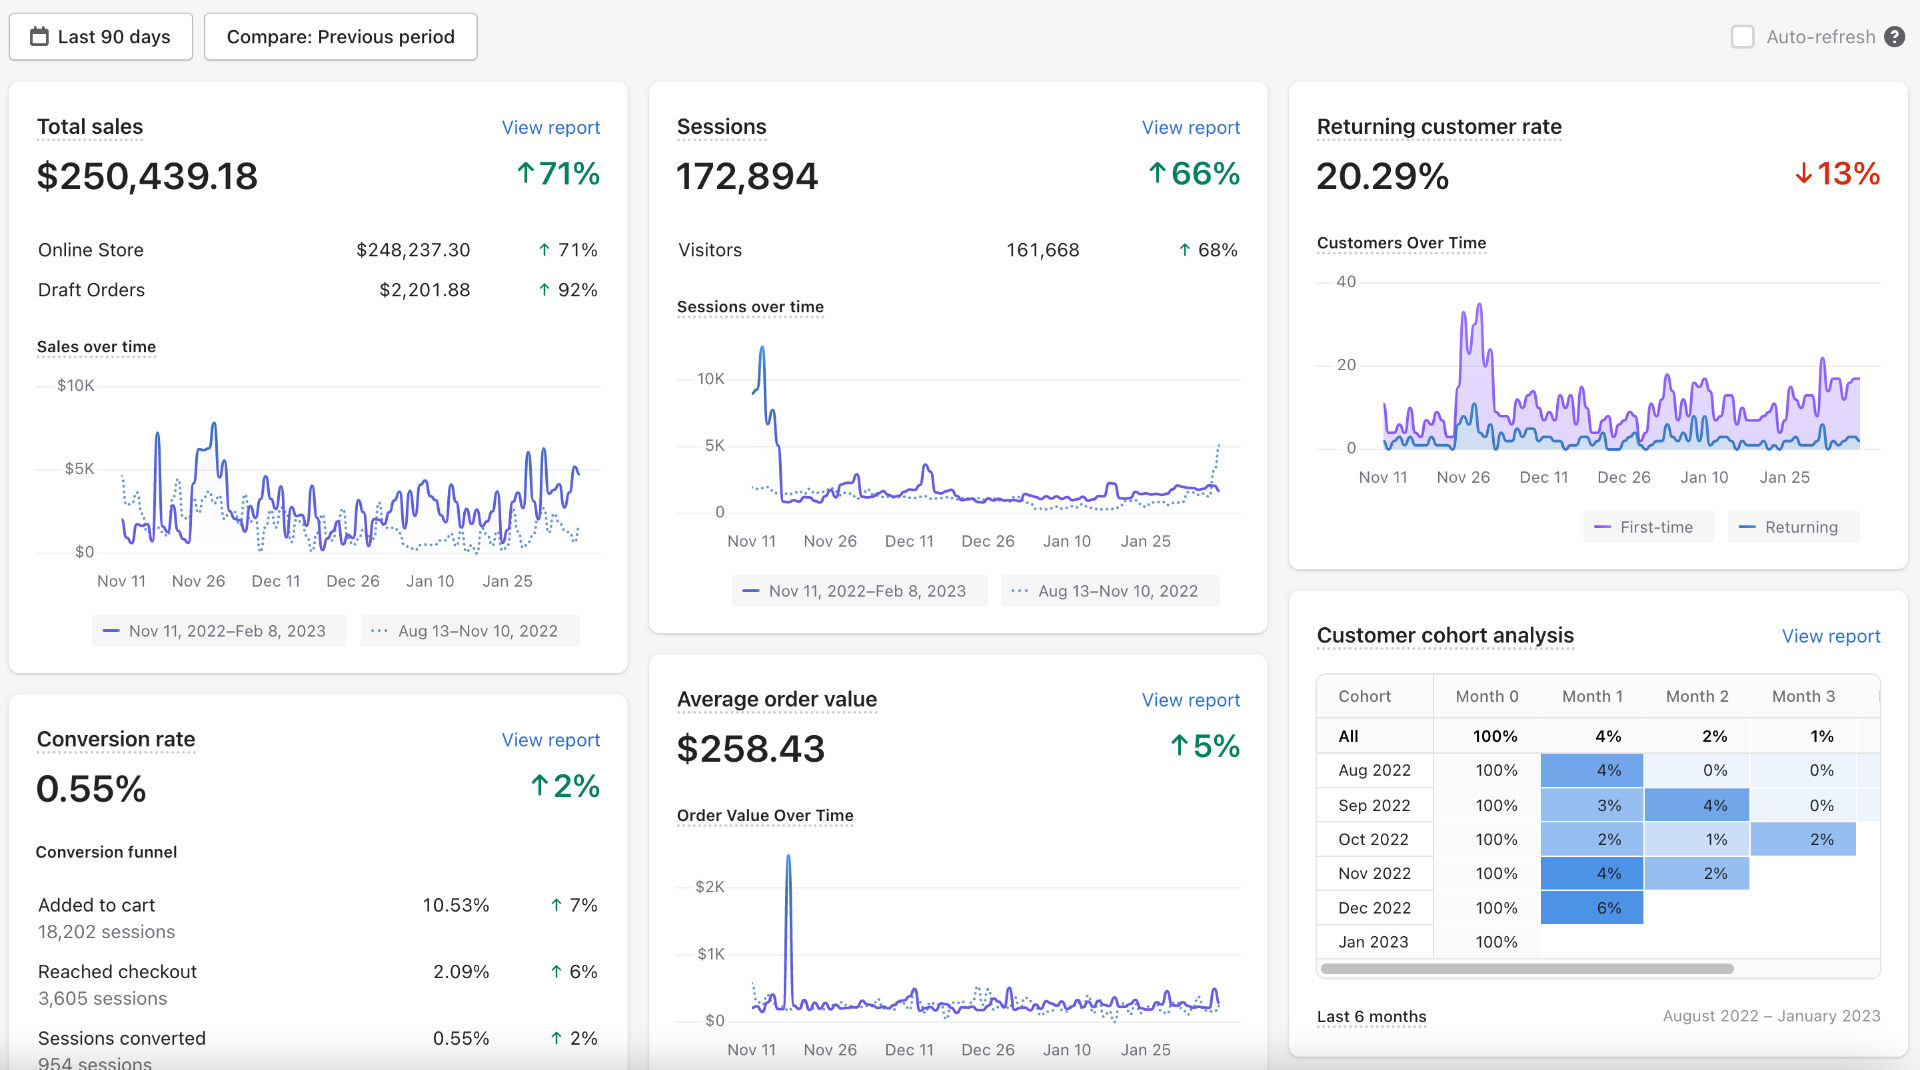
$250K Last 90 Days — ↑71% (Nov 2022 – Feb 2023)
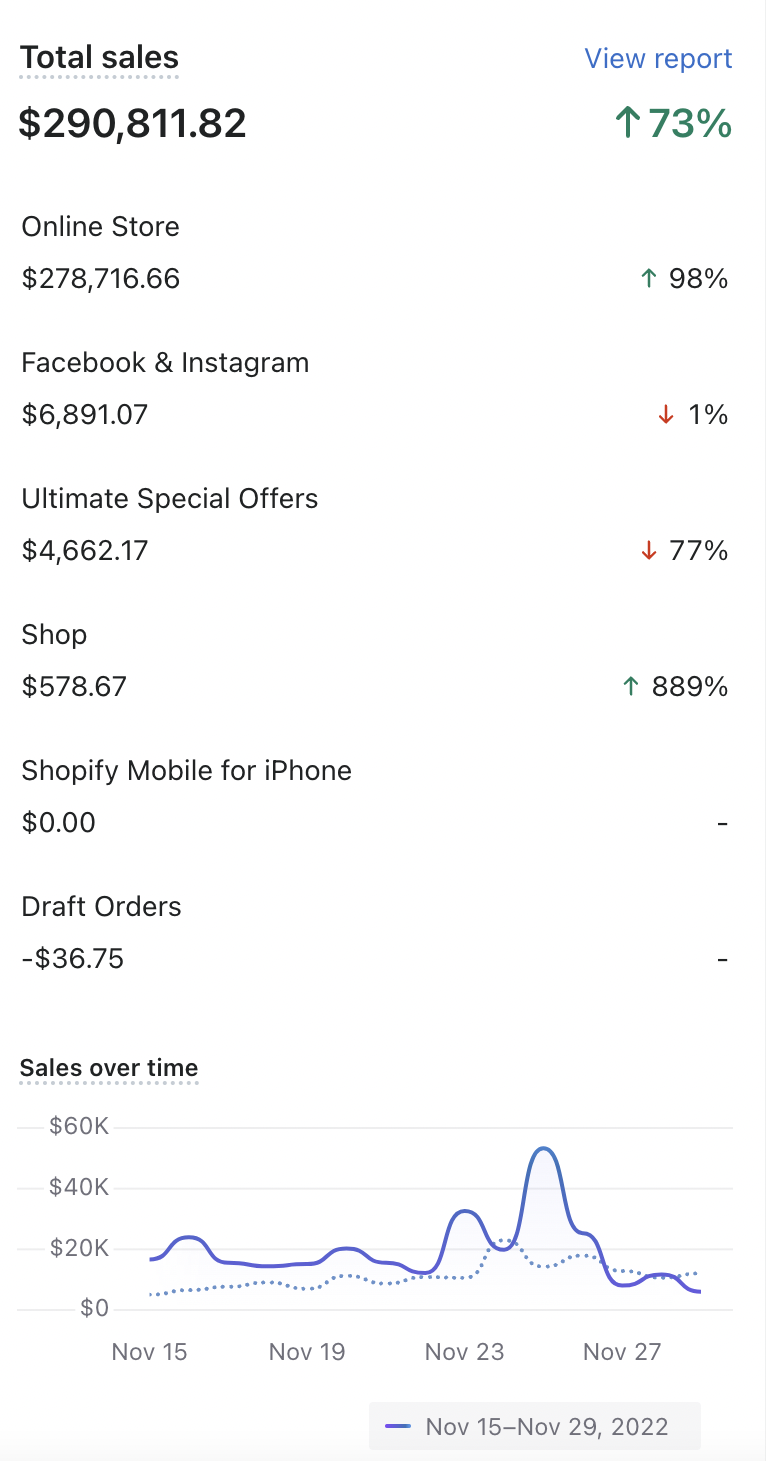
$290K BFCM Fortnight — ↑73% (Nov 15–29, 2022)
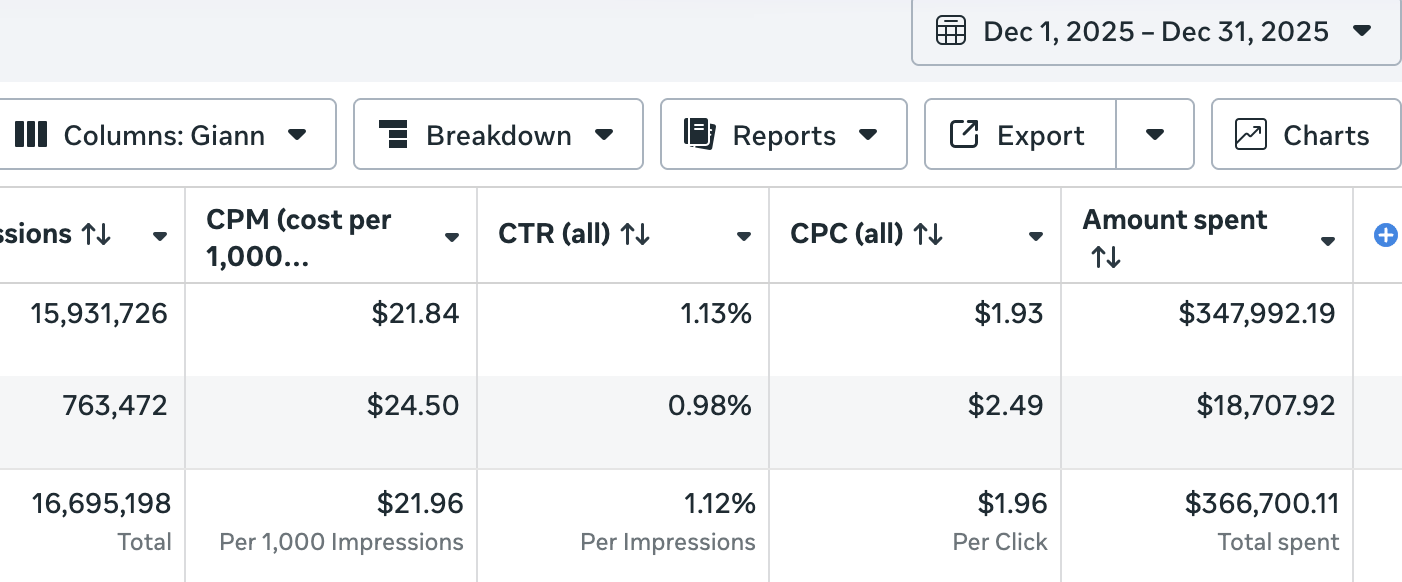
$366K Spent in a Single Month
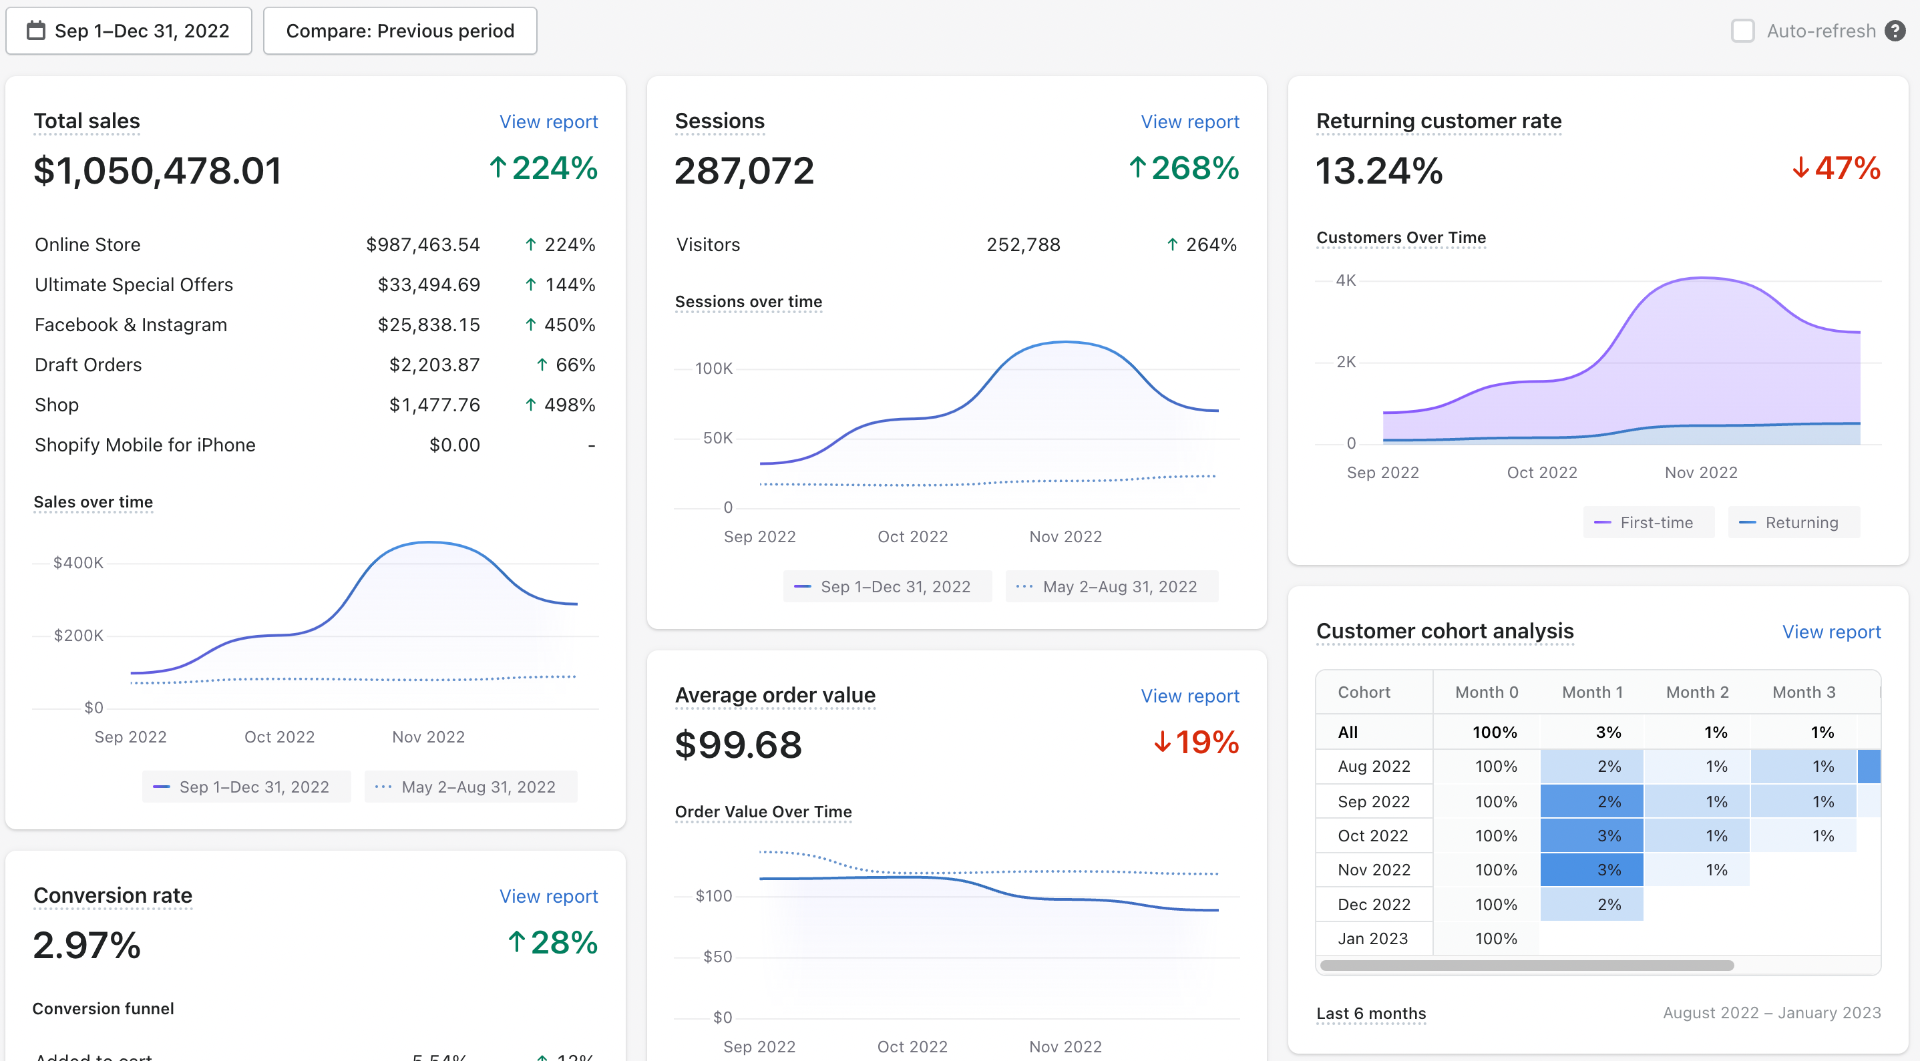
$1.05M Q4 2022 Sales — ↑224% (Sep–Dec)
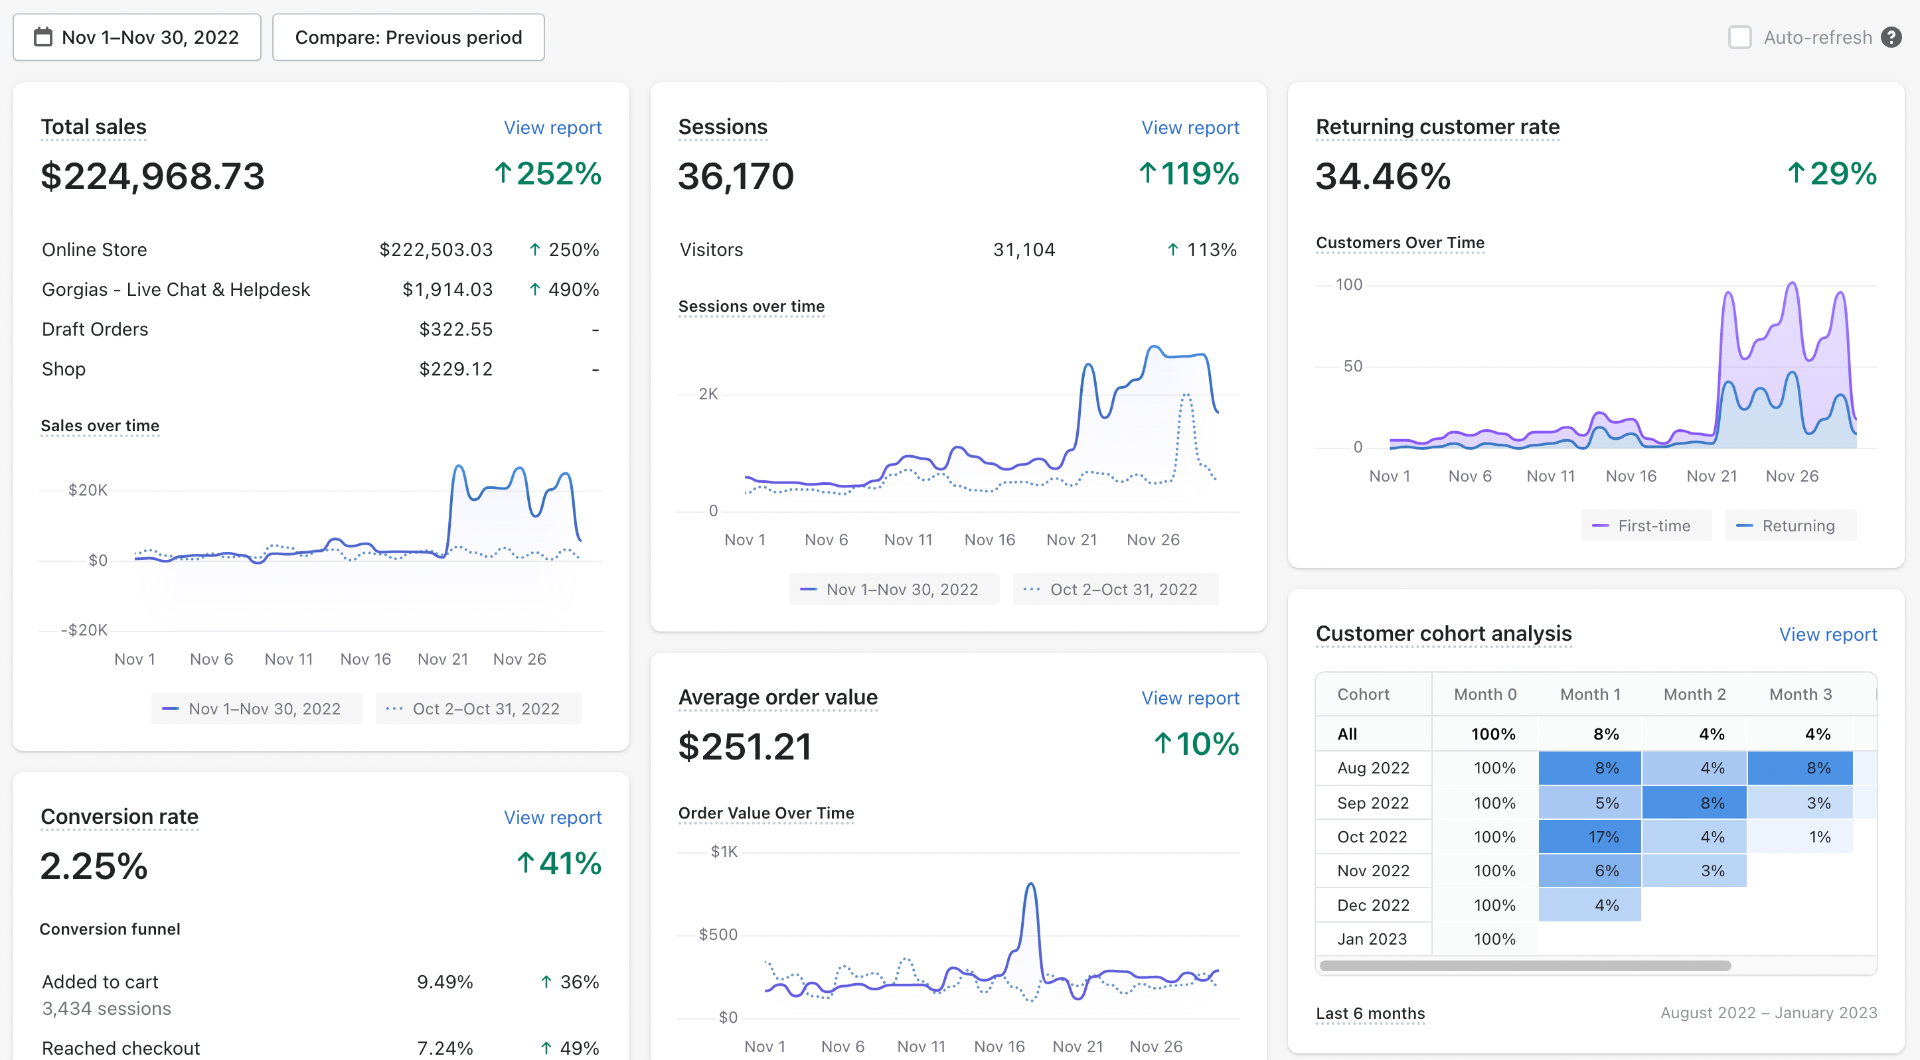
$224K November 2022 — Full Dashboard (34% Returning)
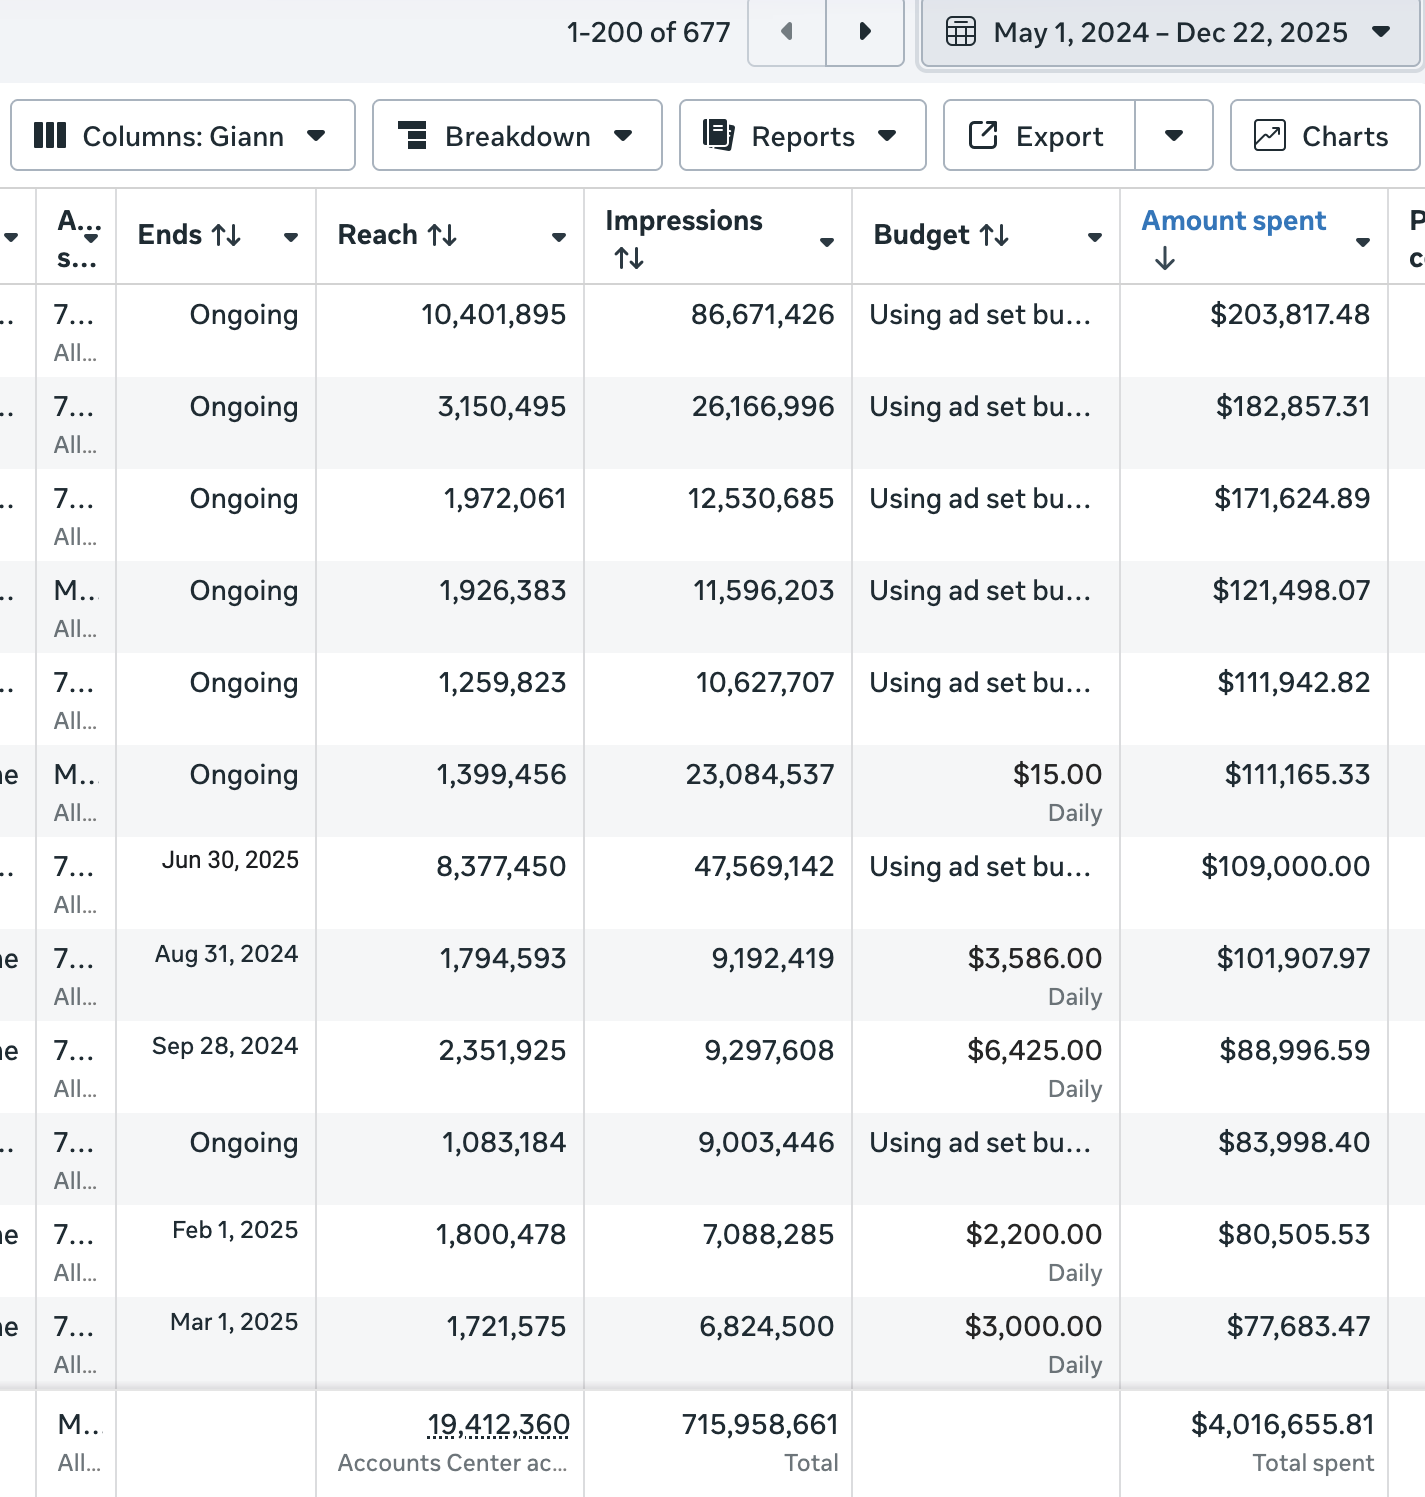
Meta Ads — $4M Spent (May 2024 – Dec 2025)
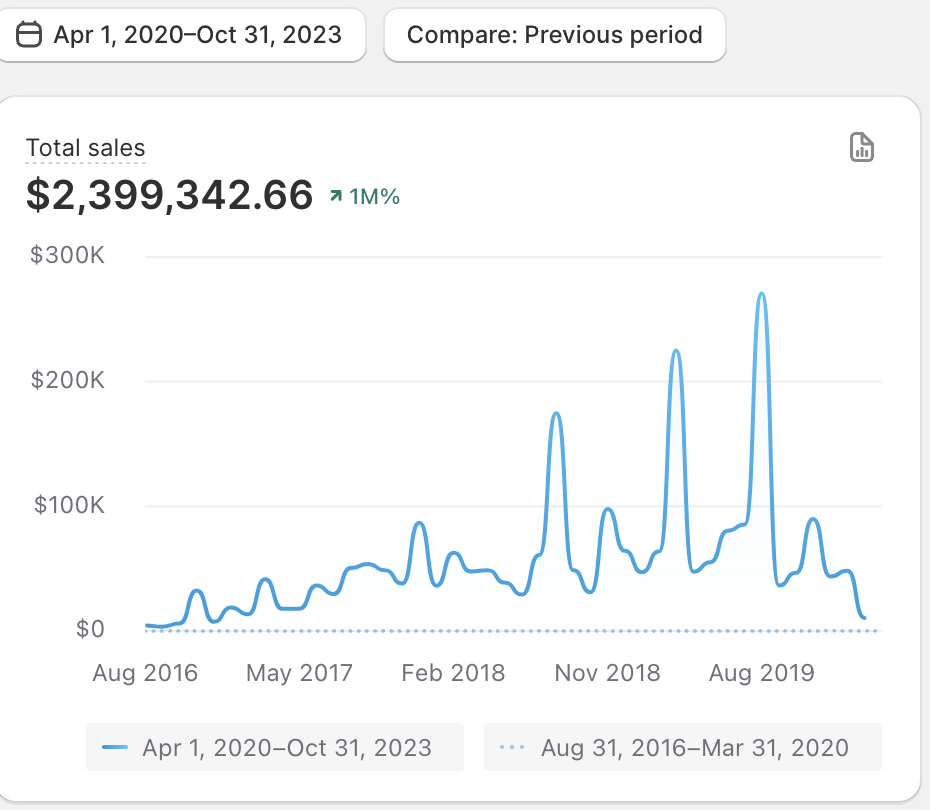
$2.4M Sales (Apr 2020 – Oct 2023) — ↑1M%
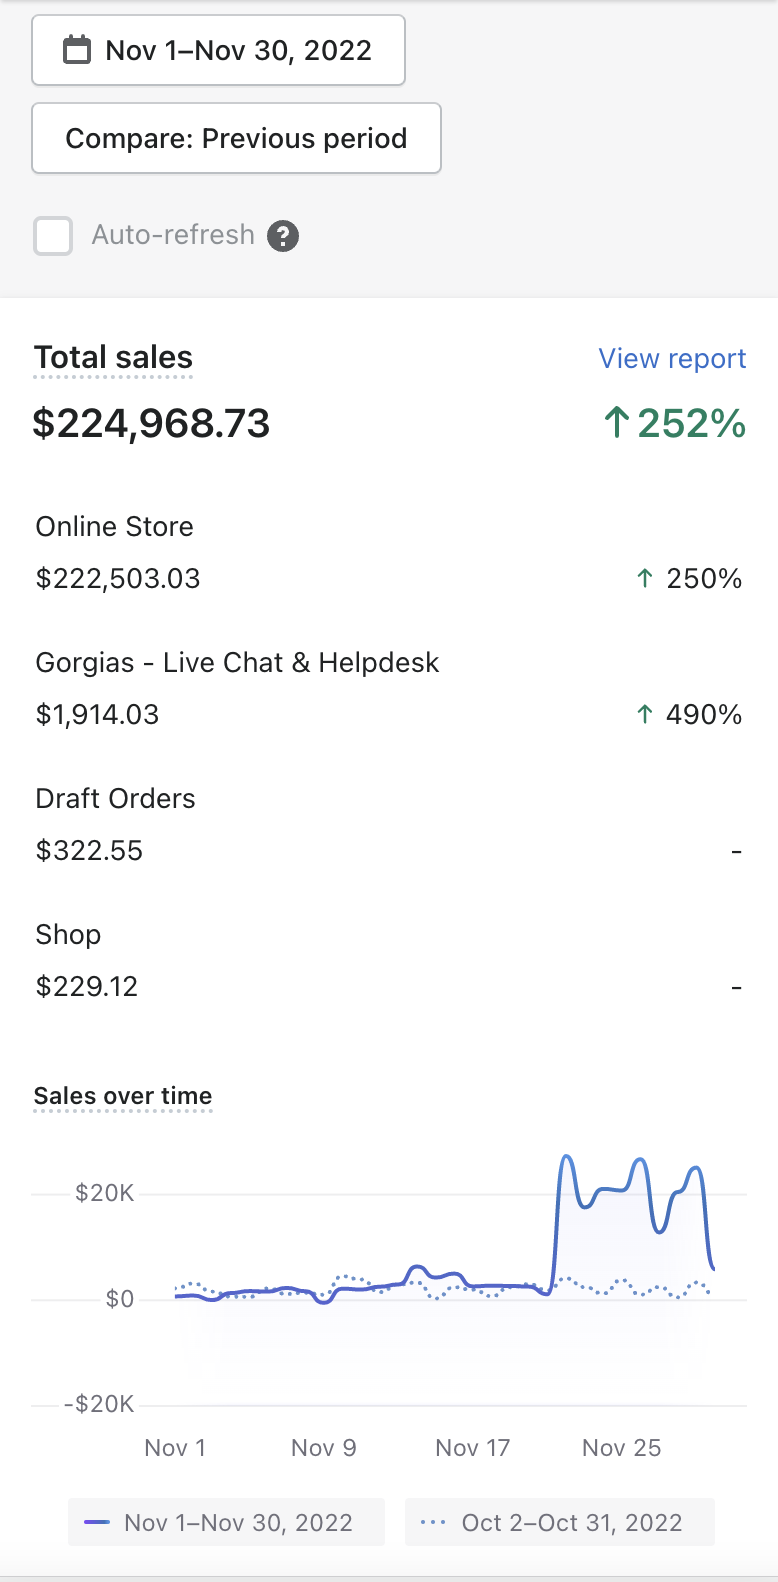
$224K November 2022 — ↑252% (Mobile View)
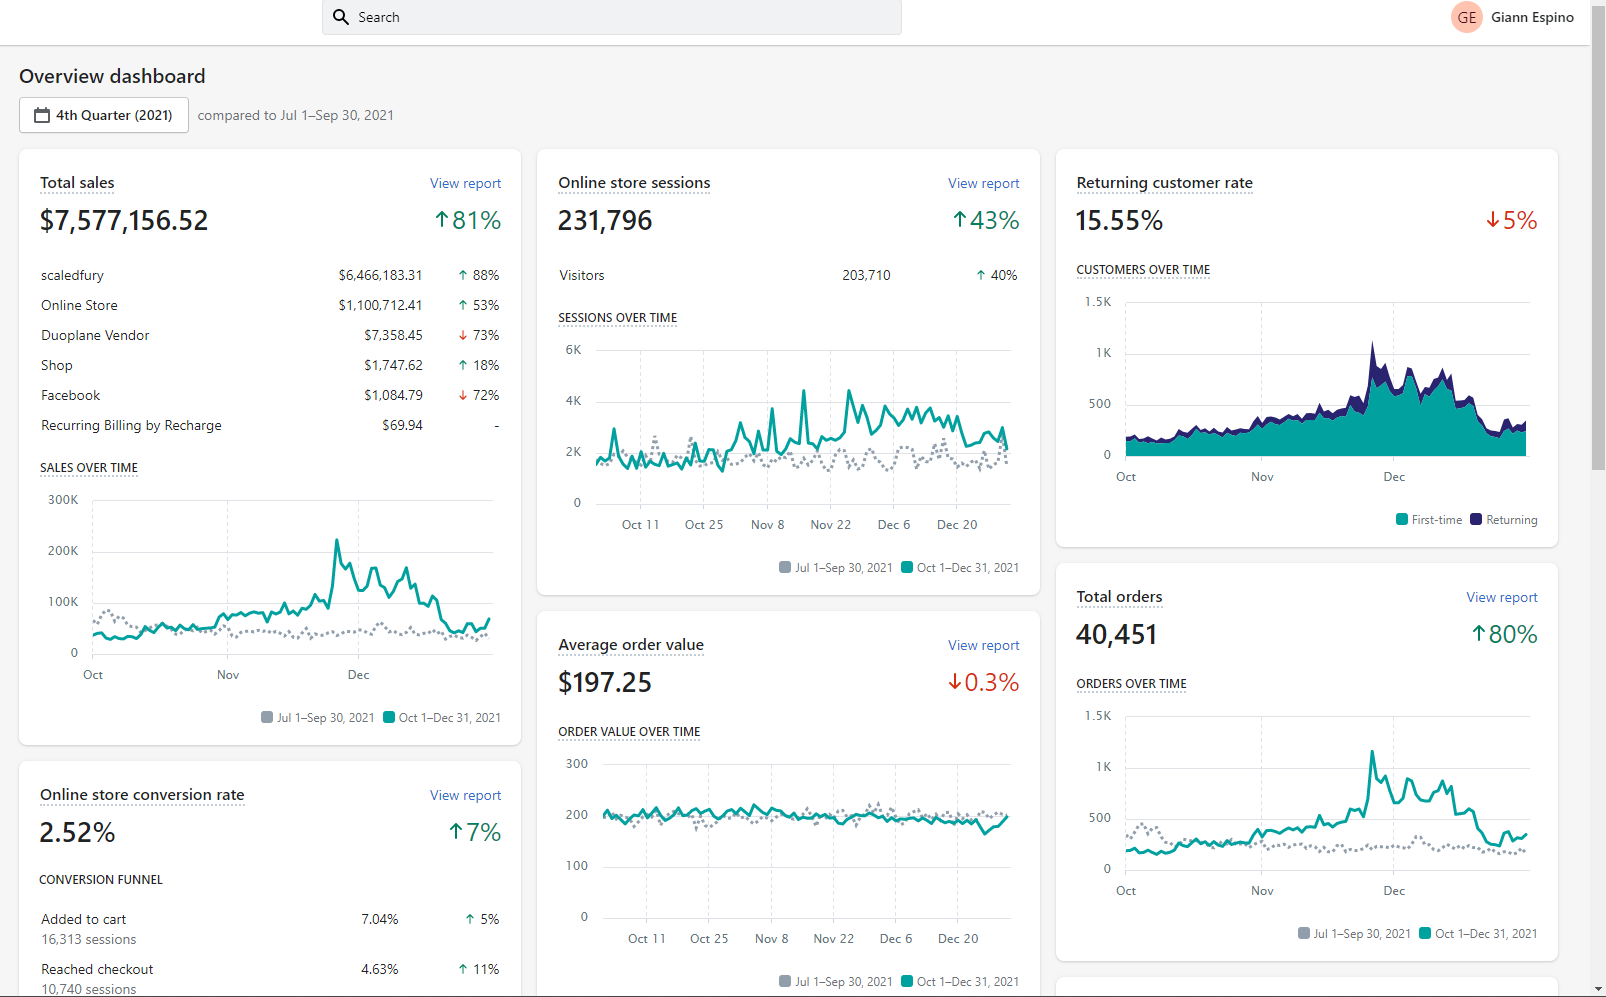
$7.57M Q4 2021 Sales — ↑81% QoQ
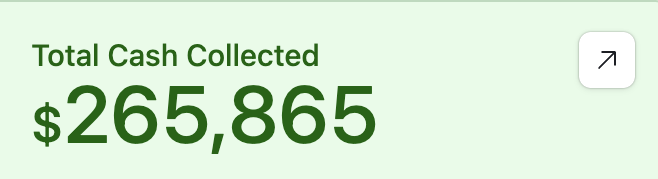
$265K Cash Collected (Additional Account)
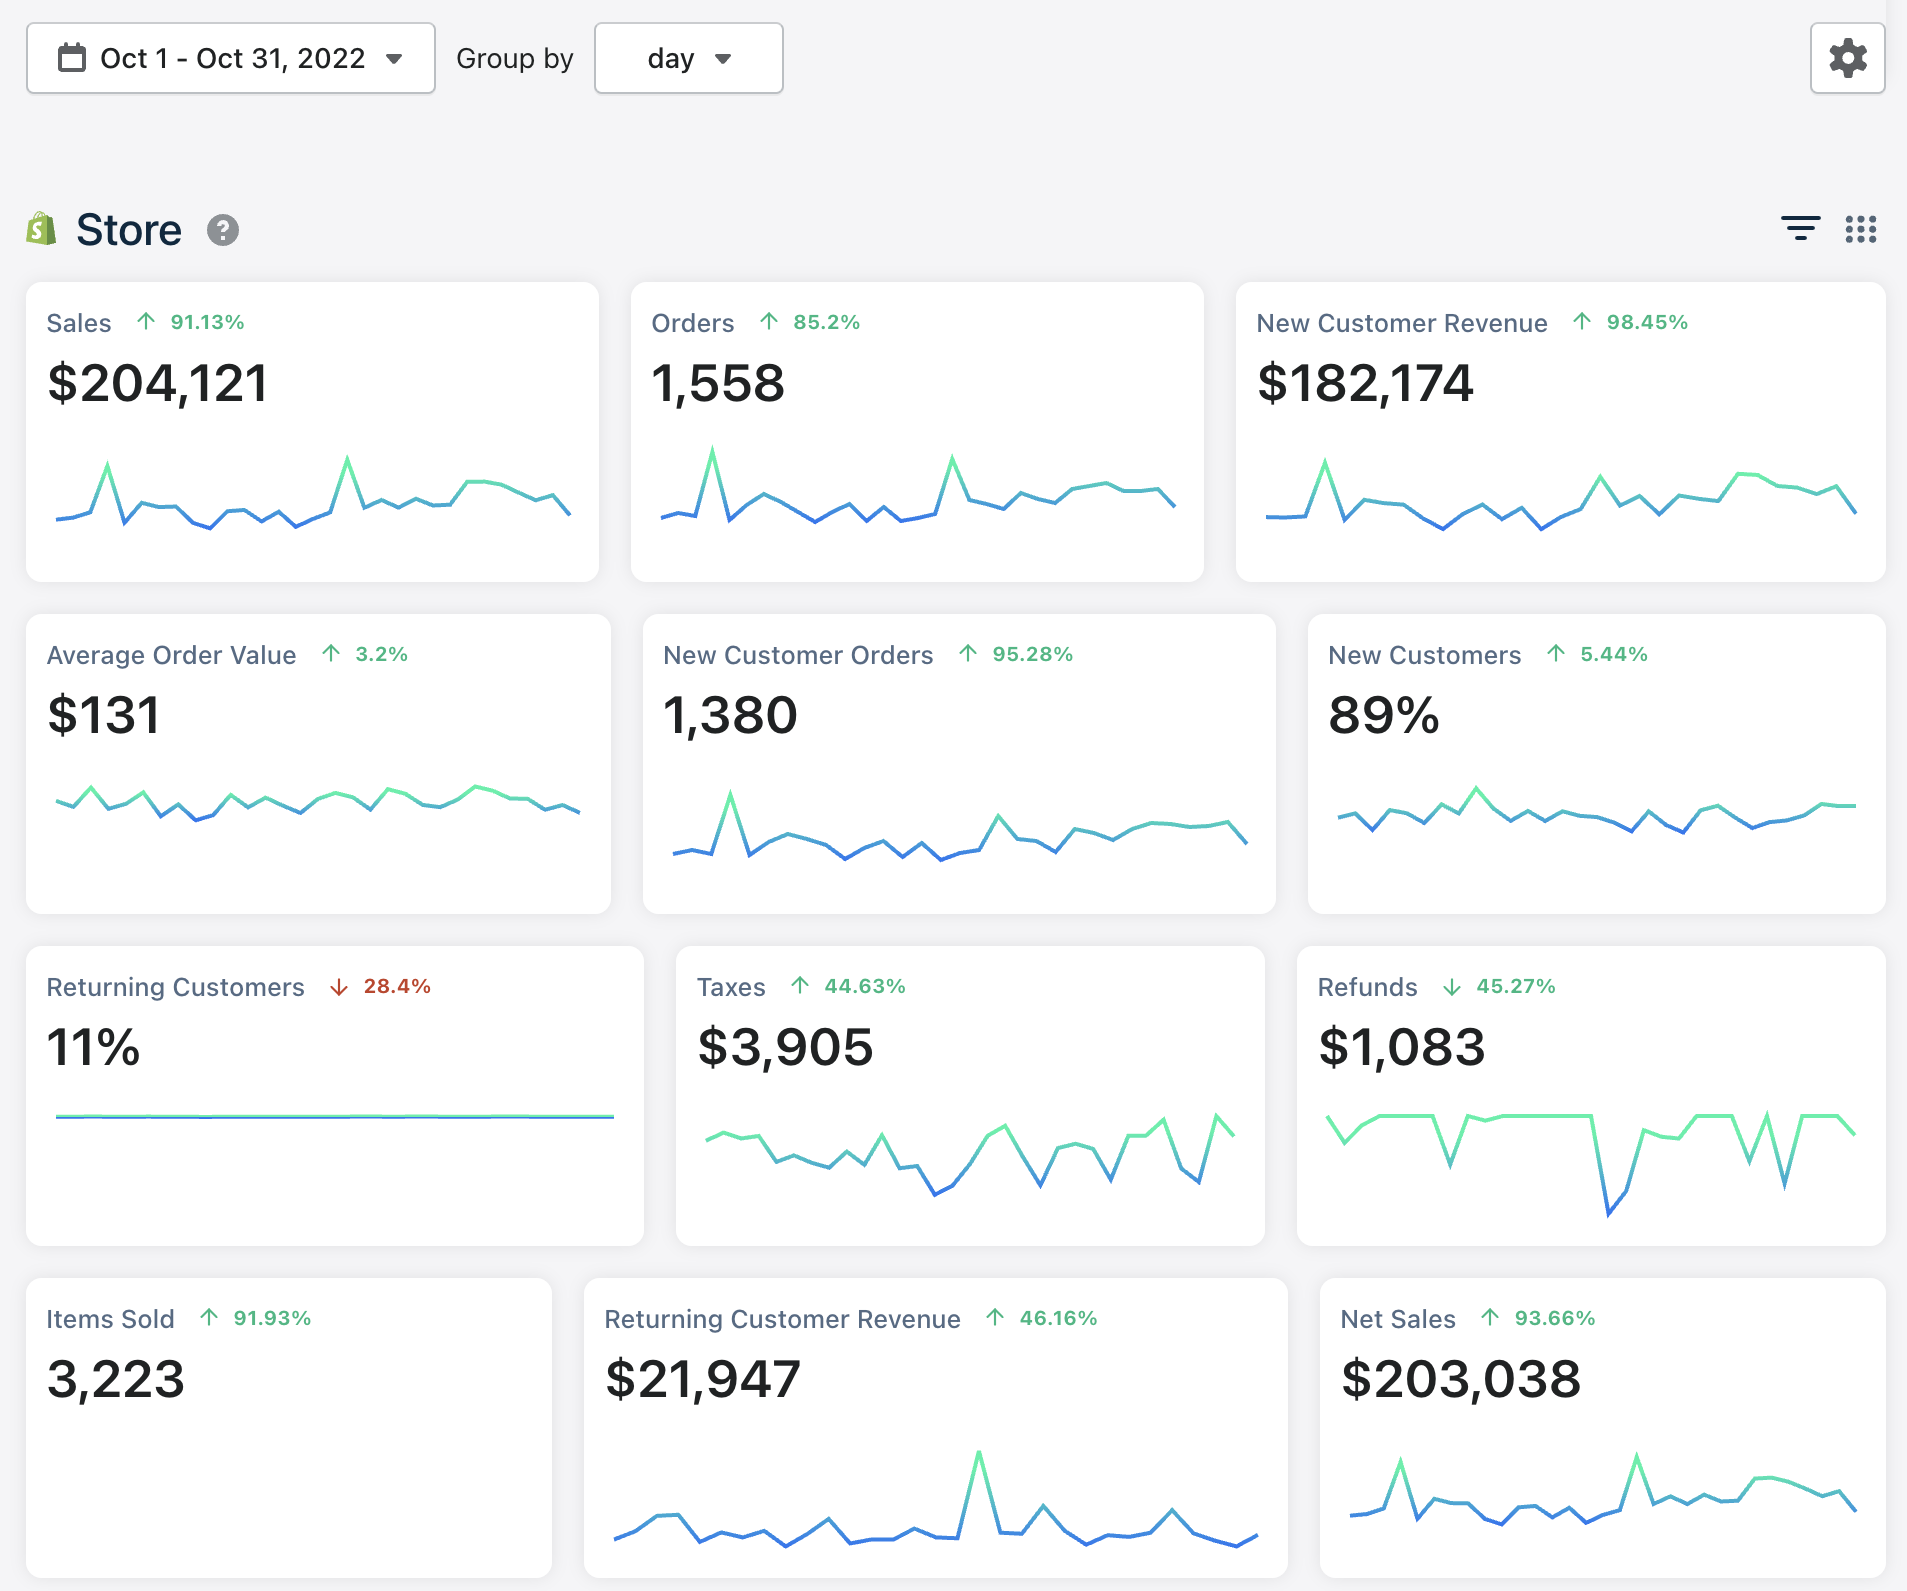
$204K October 2022 — ↑91% (Triple Whale Store)
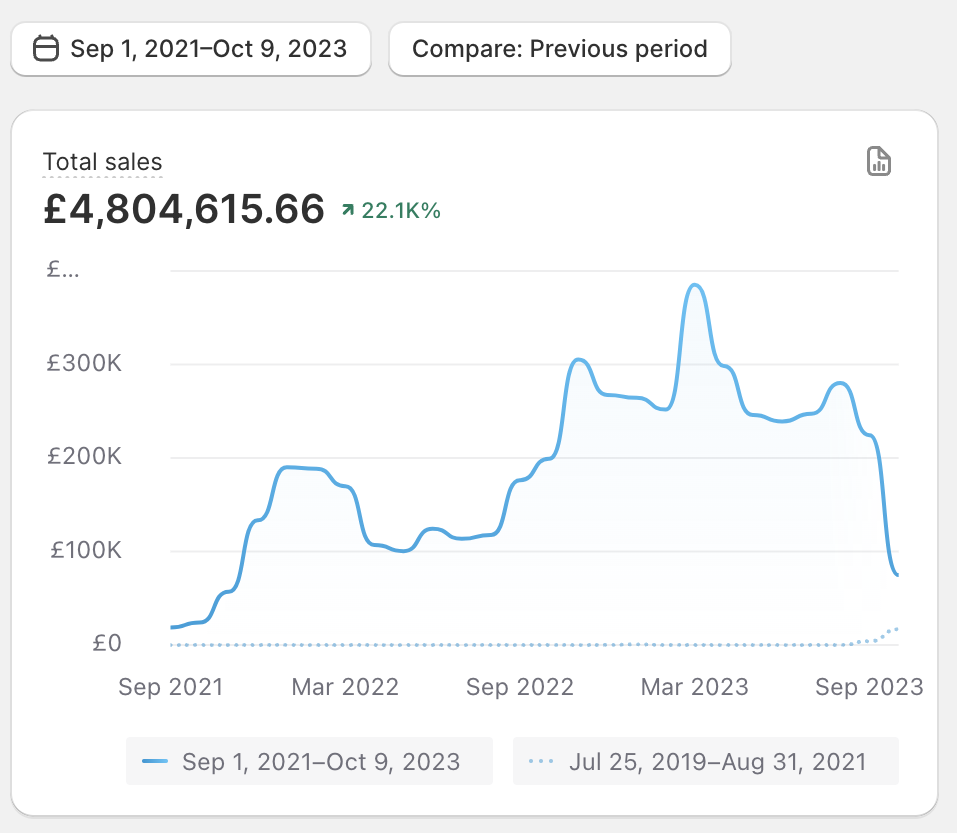
£4.8M Sales (Sep 2021 – Oct 2023) — ↑22.1K%
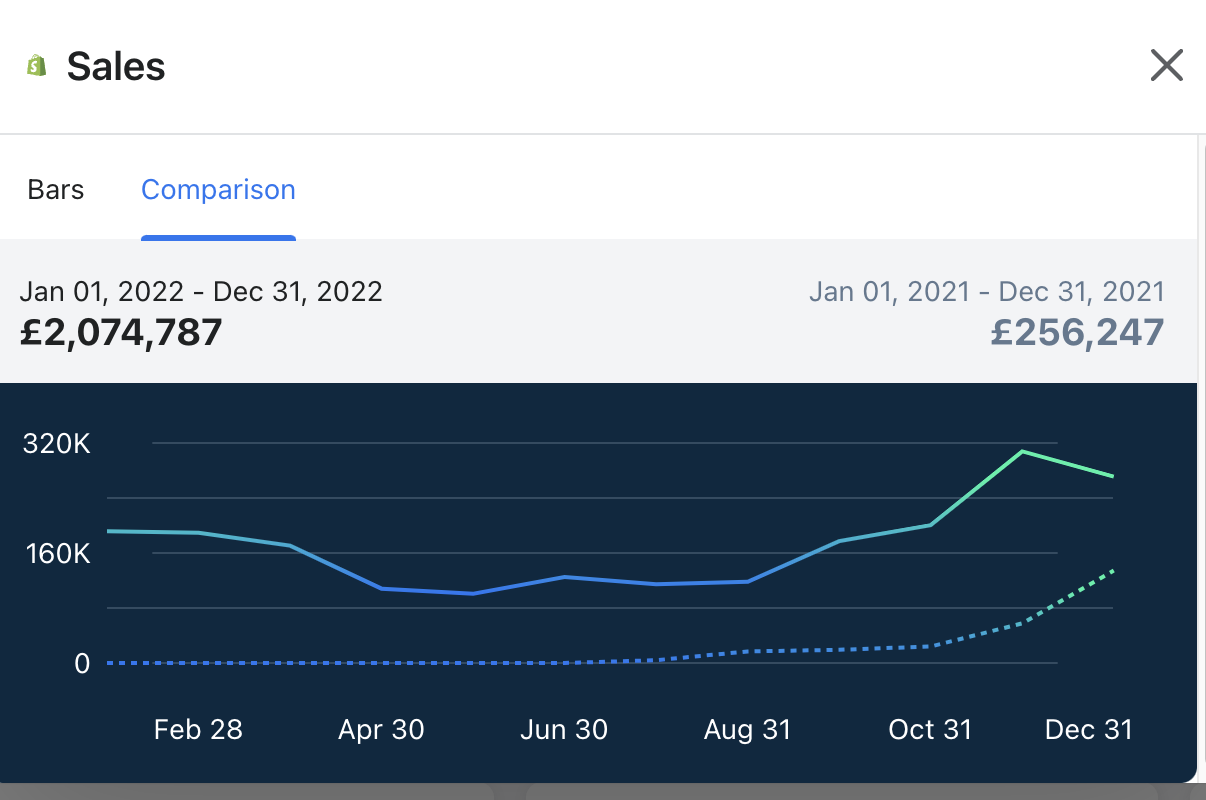
£2.07M Annual Sales — ↑709% YoY (2022 vs 2021)
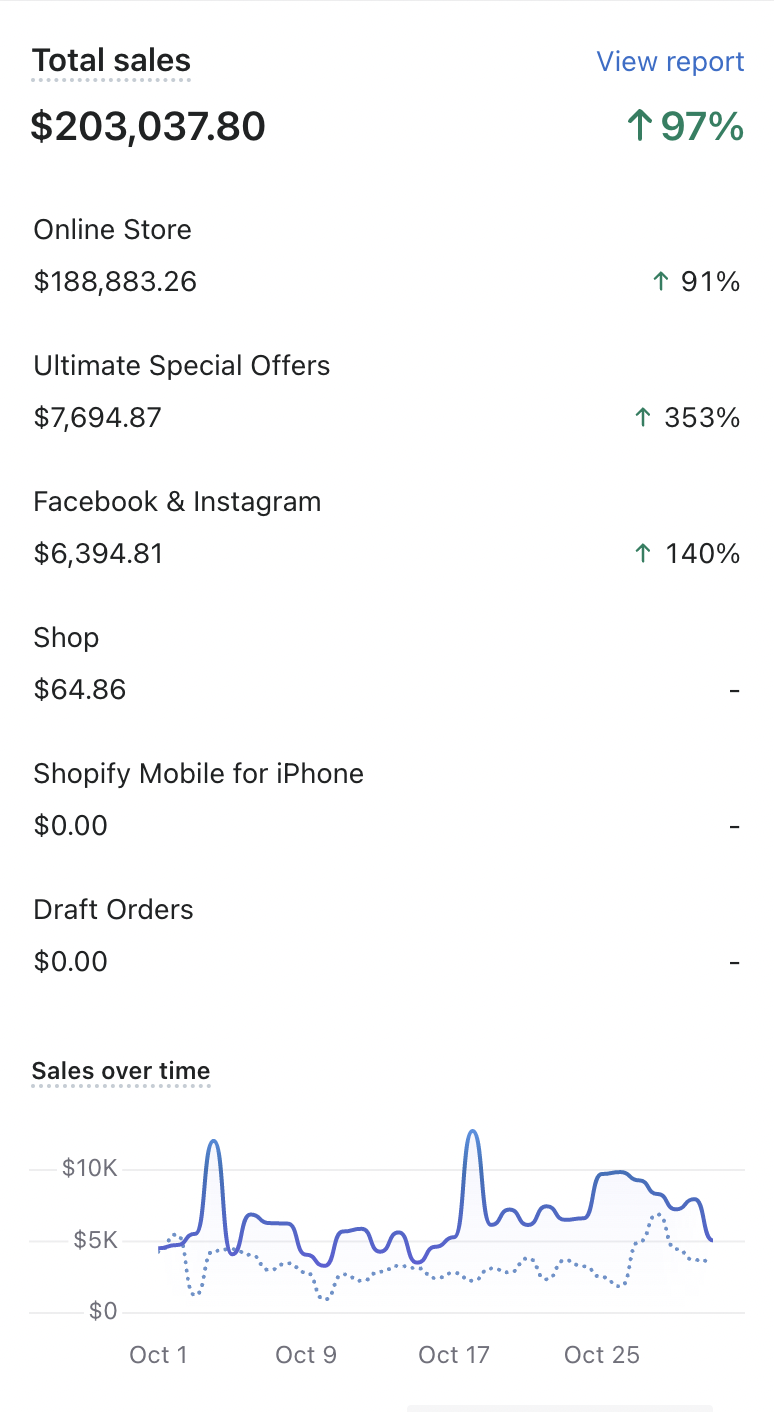
$203K October 2022 — ↑97% (Mobile View)
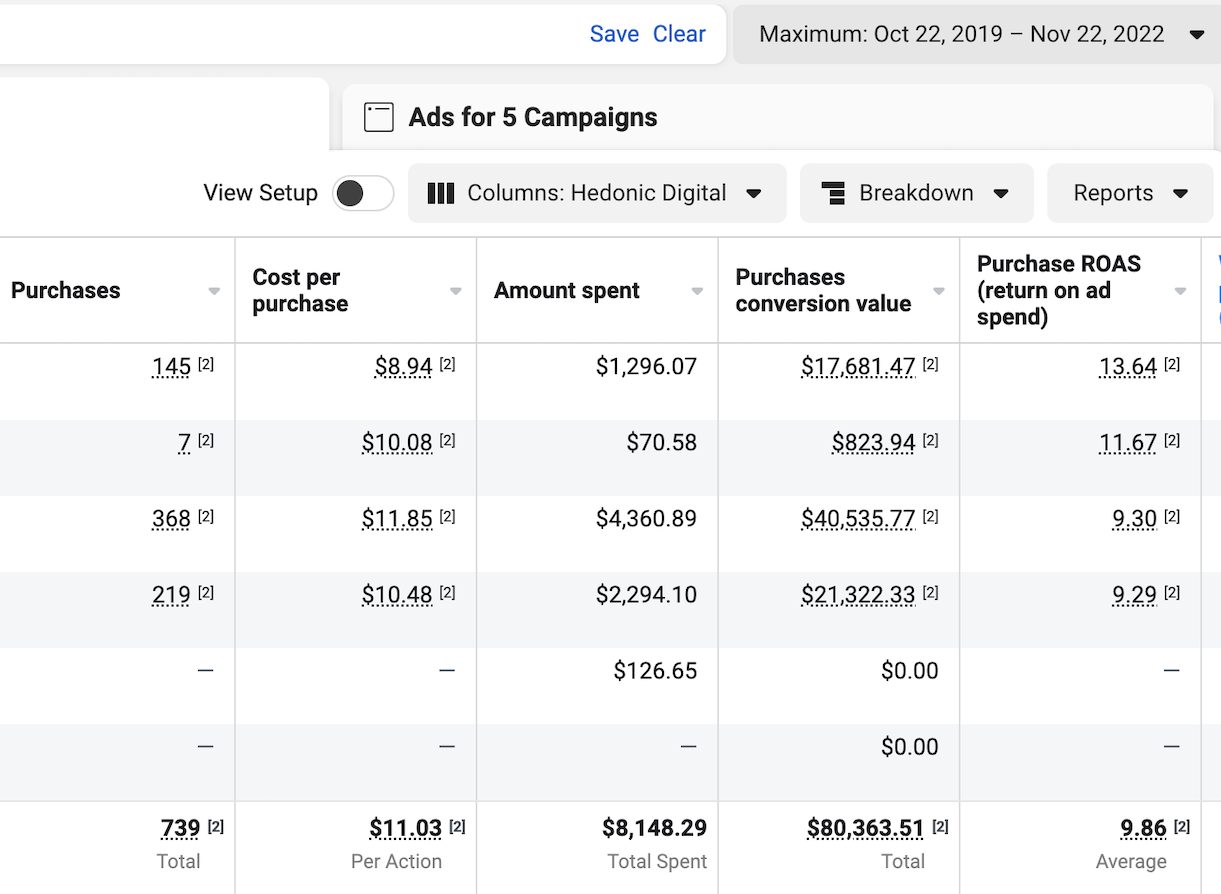
$80K Revenue from $8.1K Spend — 9.86x ROAS
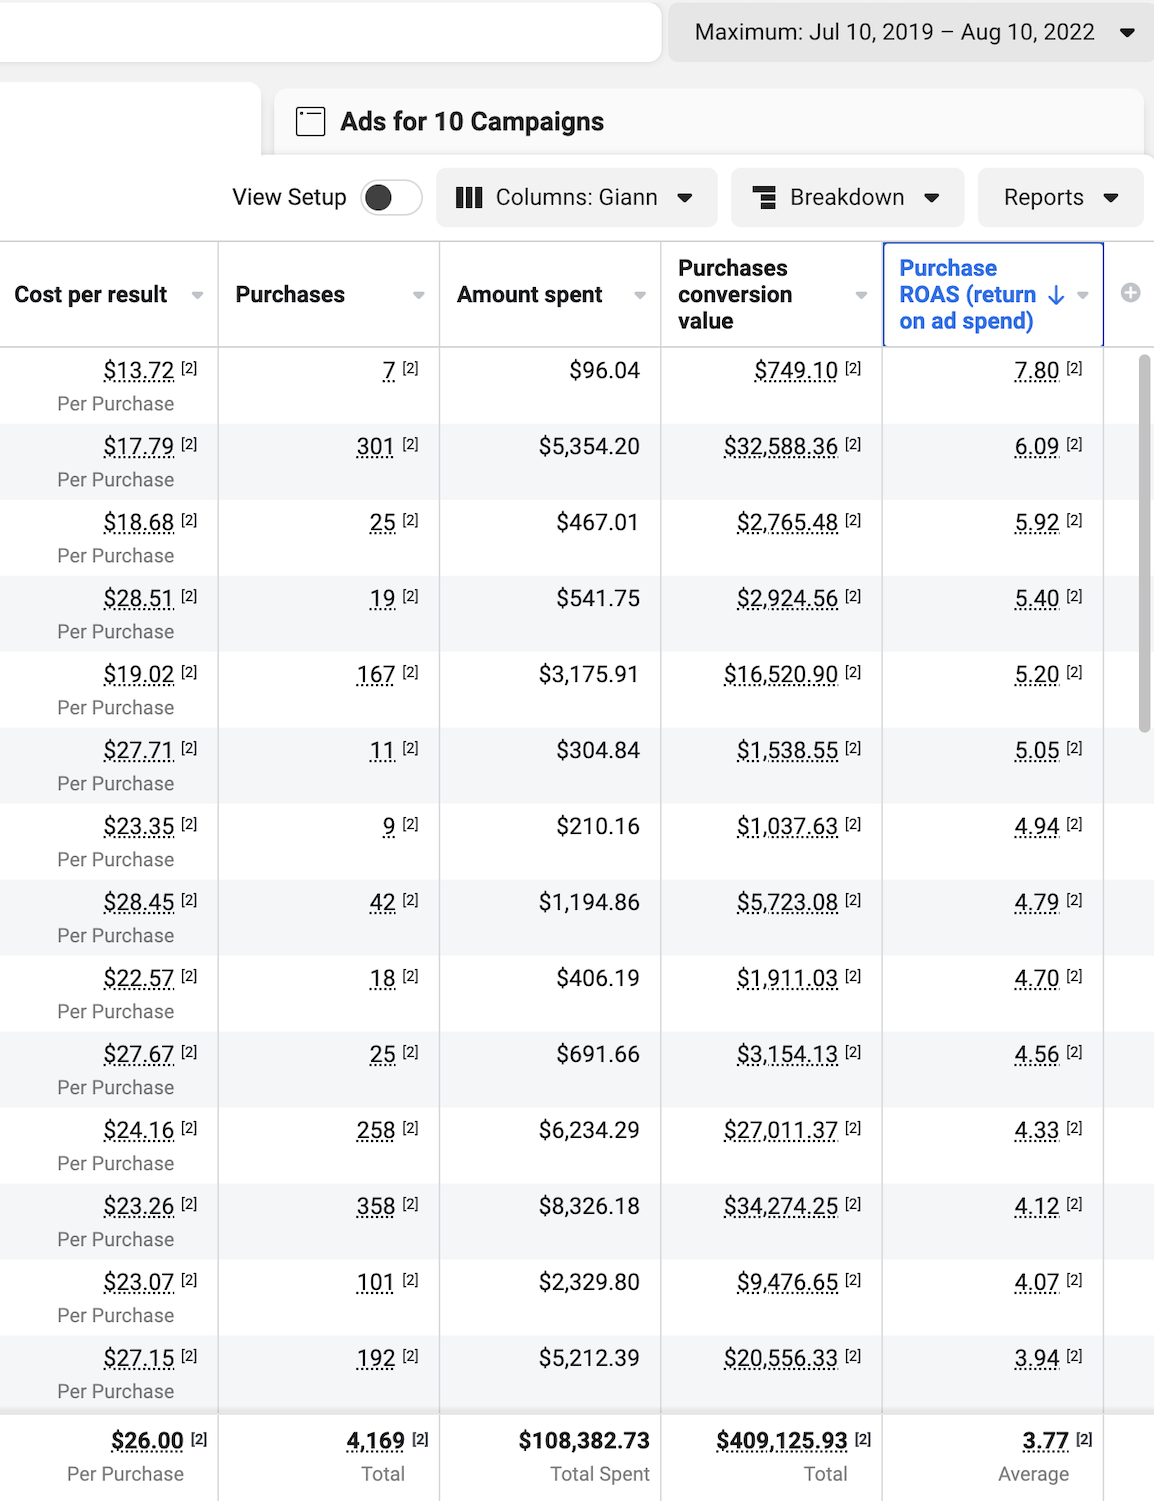
$409K Revenue from $108K Spend — 3.77x ROAS (All-Time)
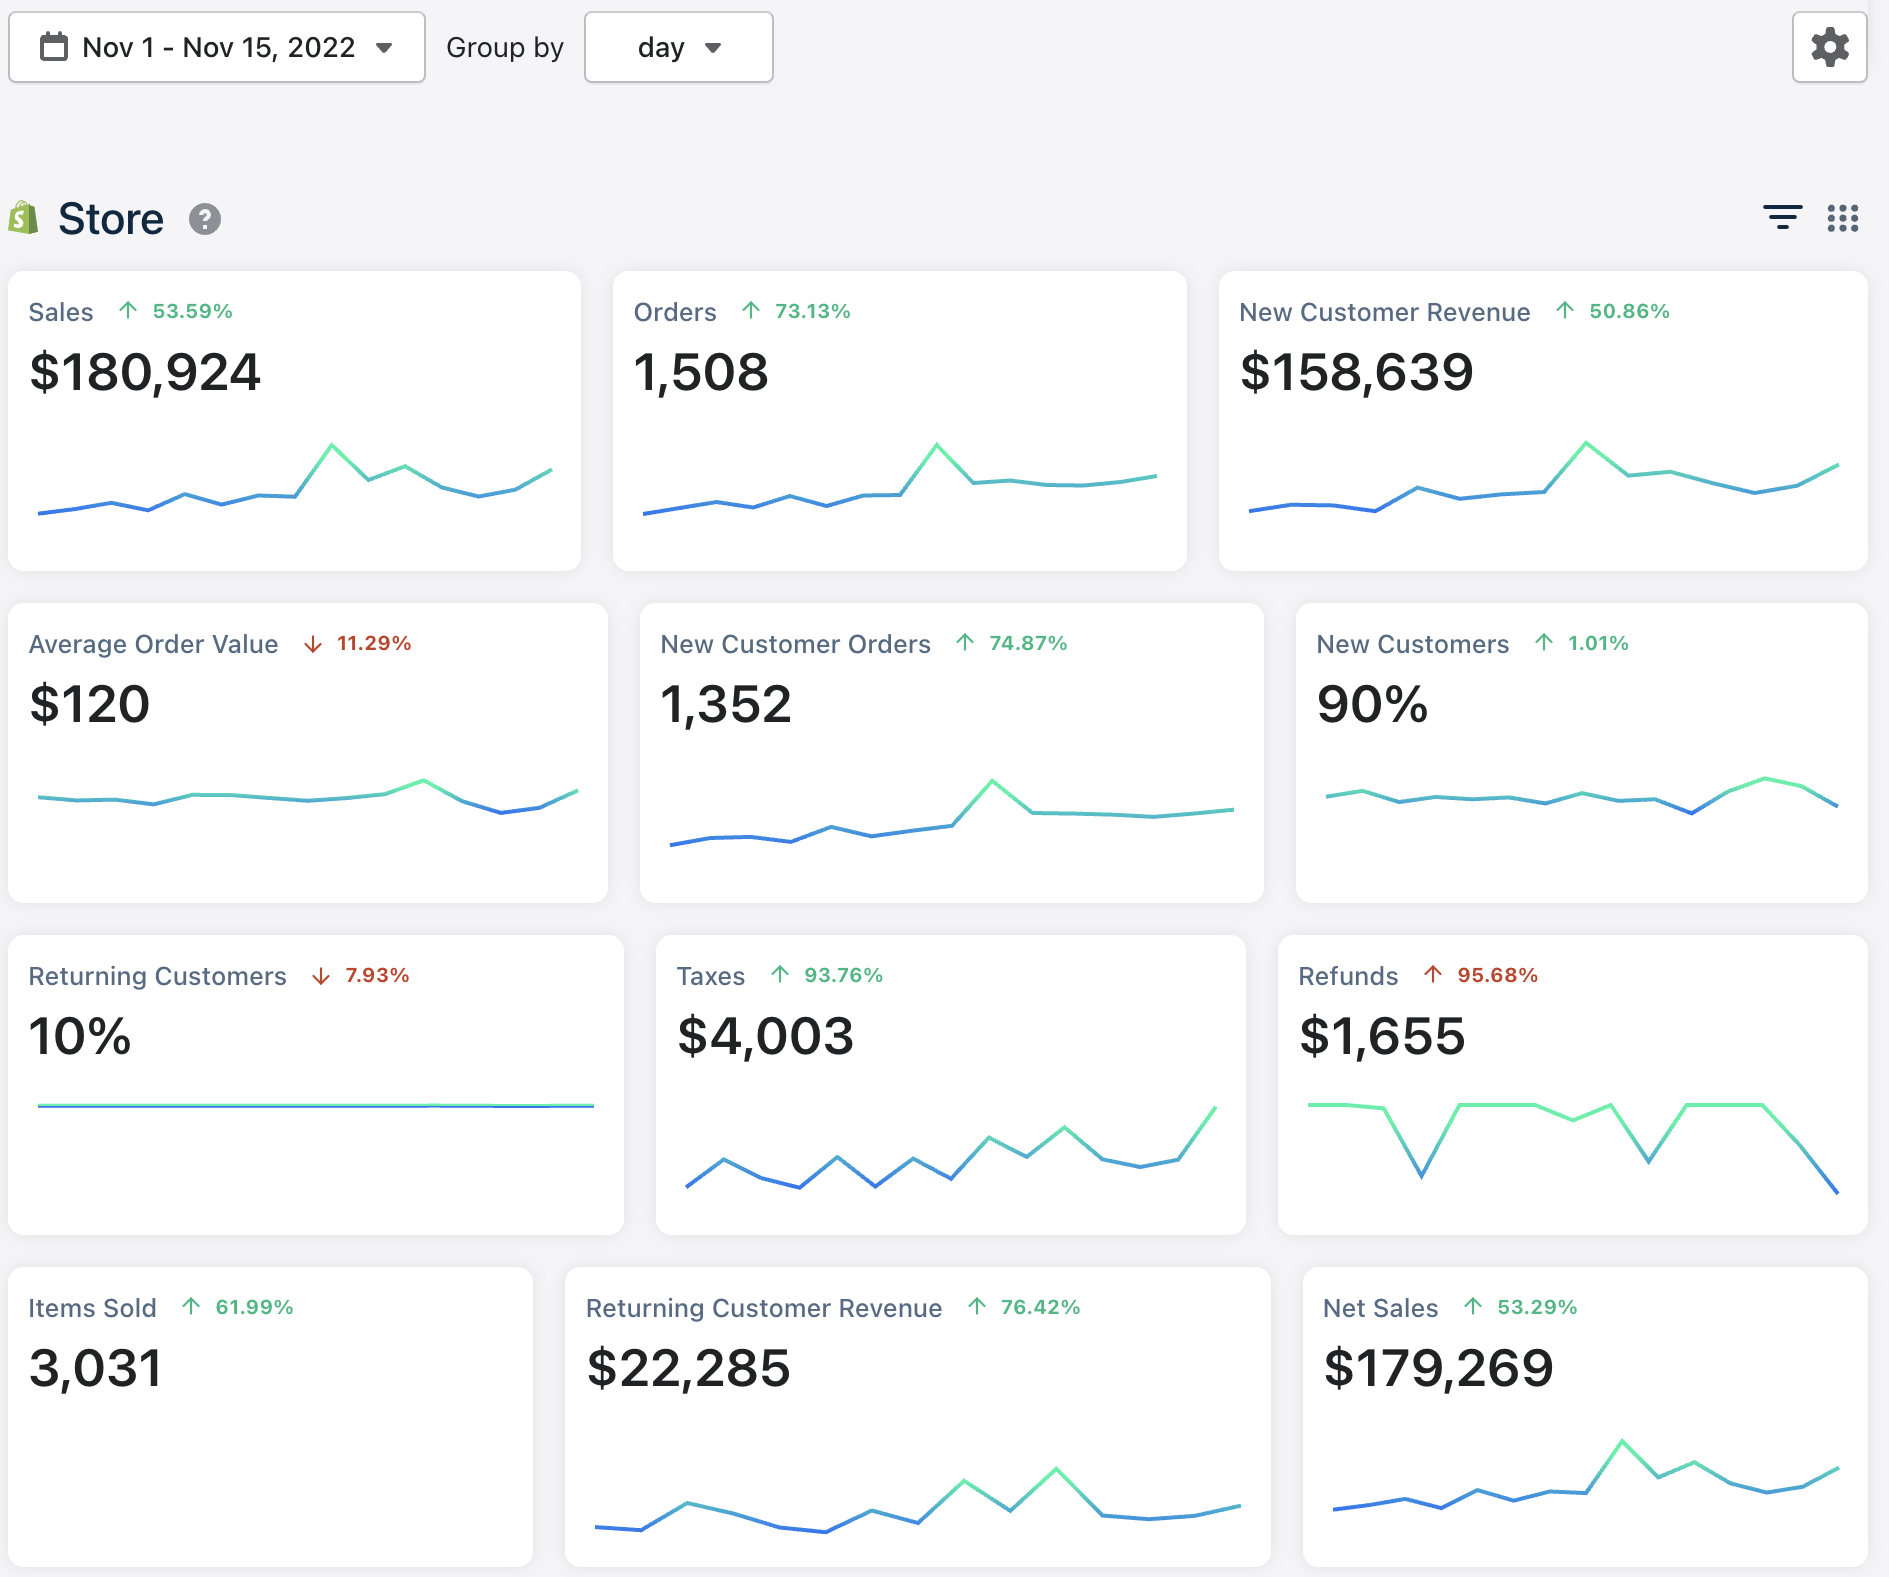
$180K First Half Nov 2022 — ↑53% (Triple Whale)
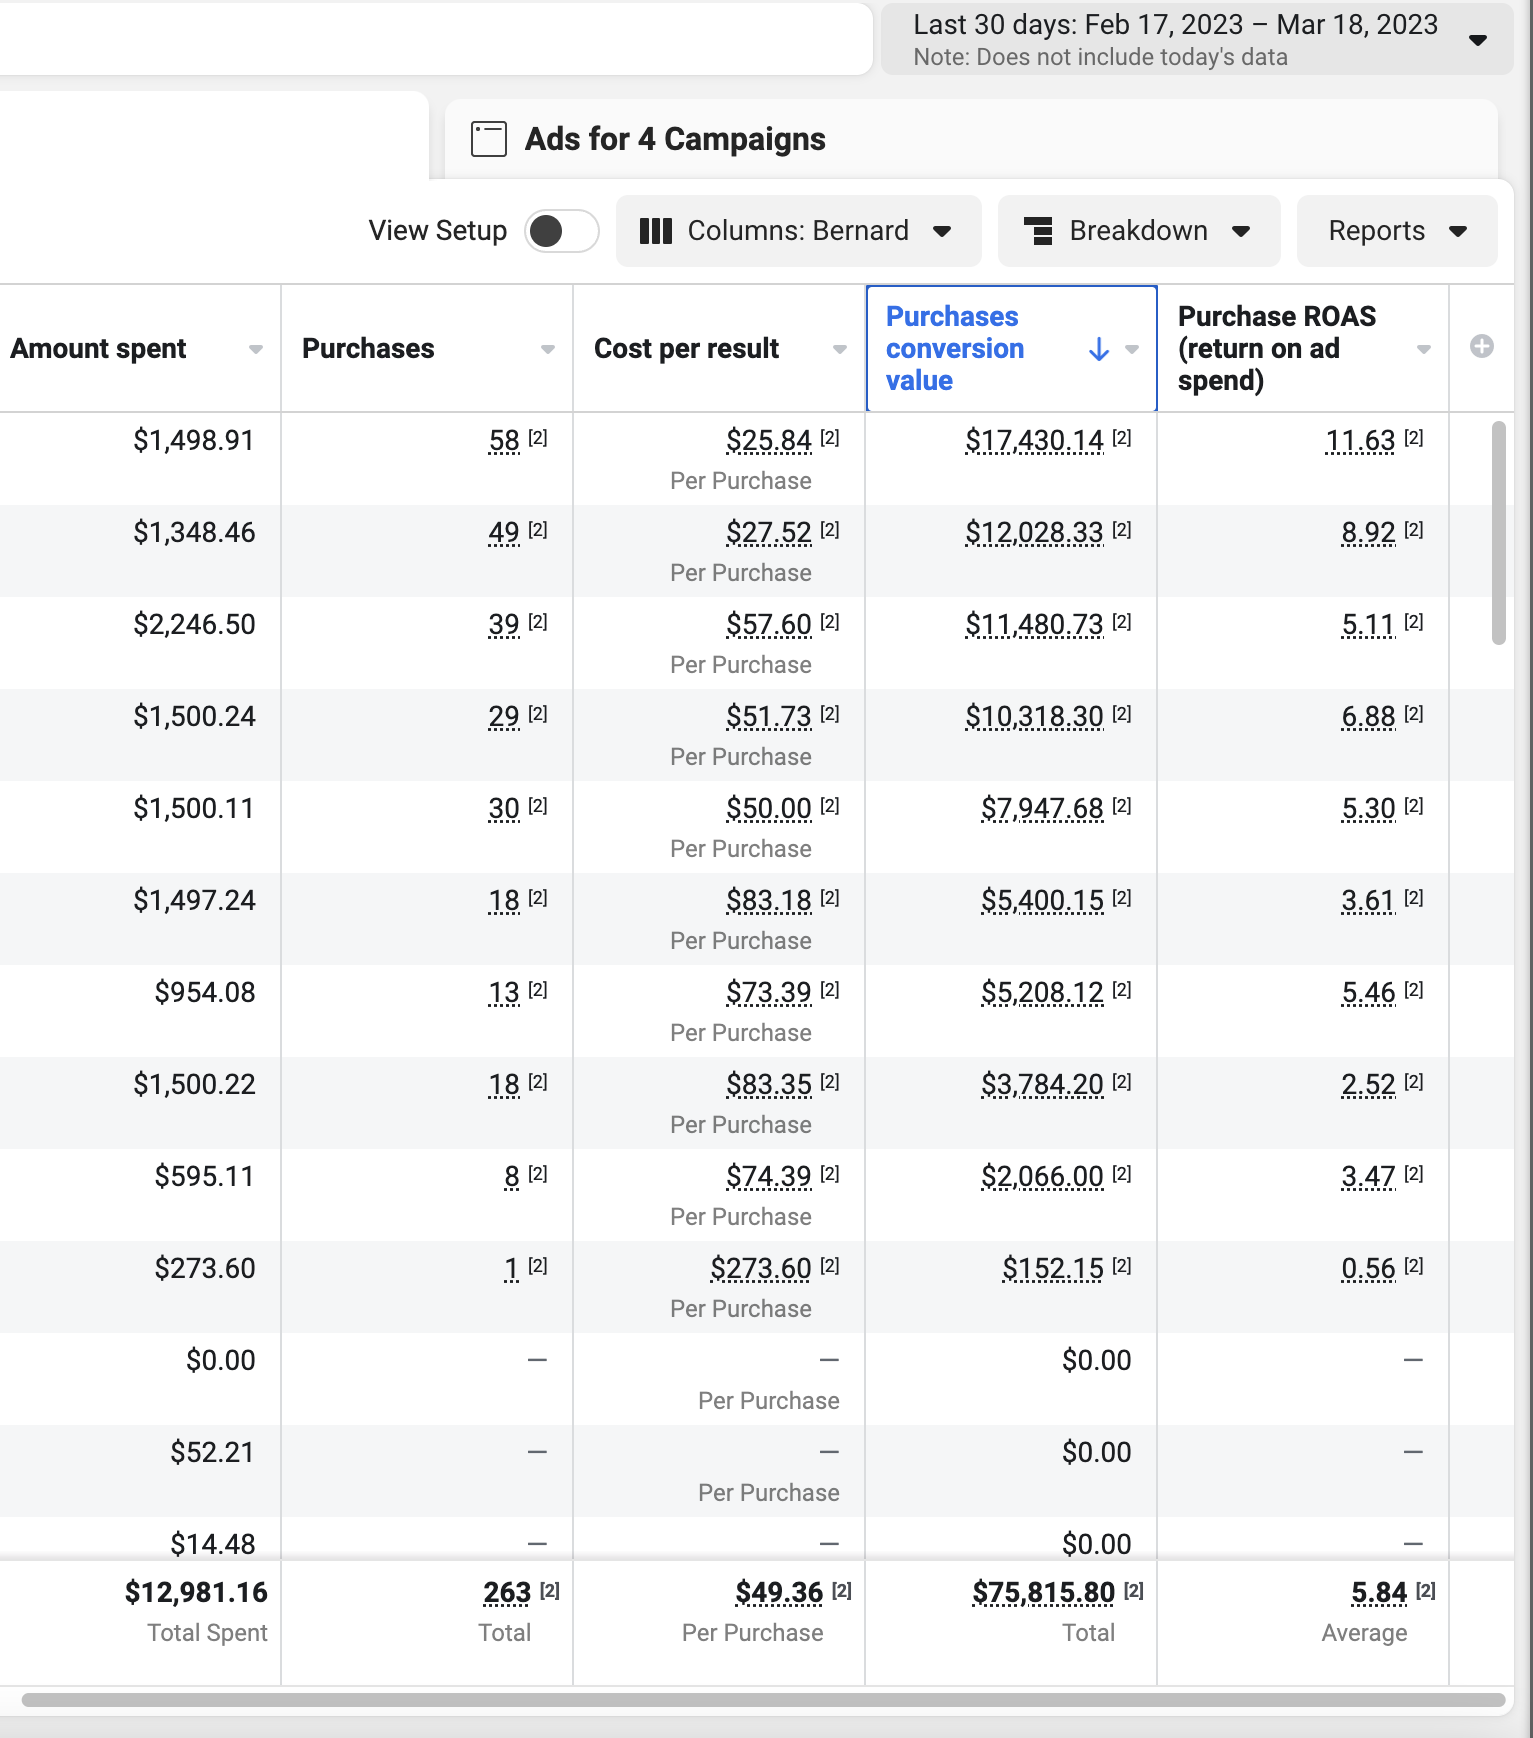
$75.8K Revenue from $12.9K Spend — 5.84x ROAS (Last 30 Days)
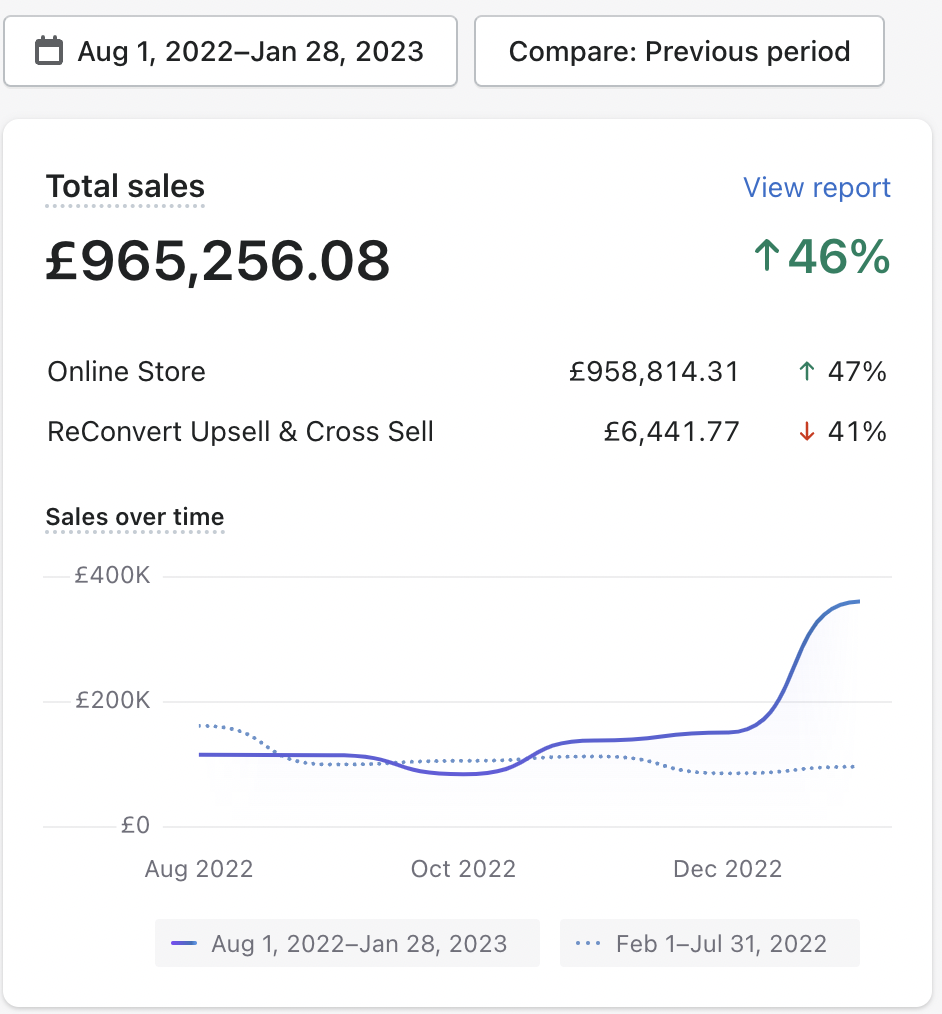
£965K in 6 Months — ↑46% (Aug 2022 – Jan 2023)
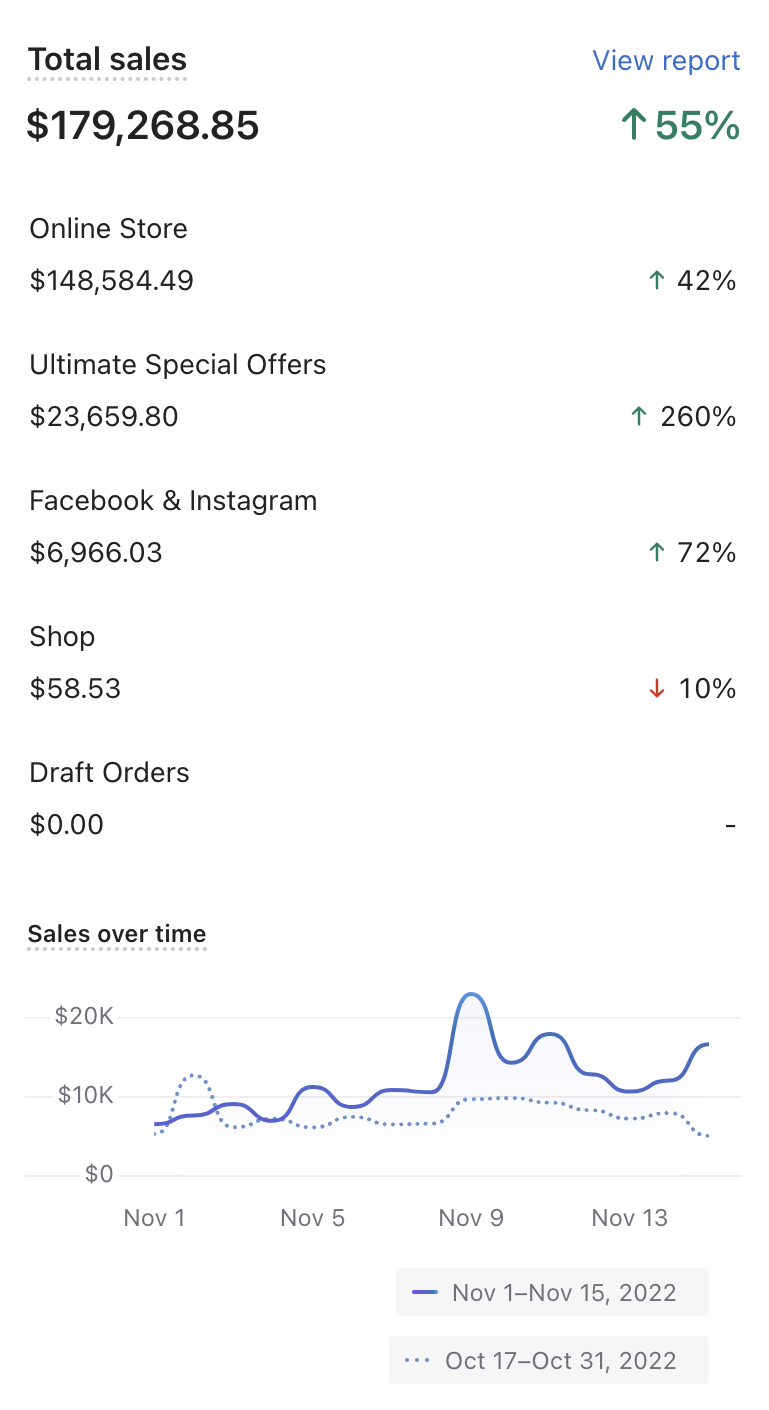
$179K First Half Nov 2022 — ↑55% (Mobile View)
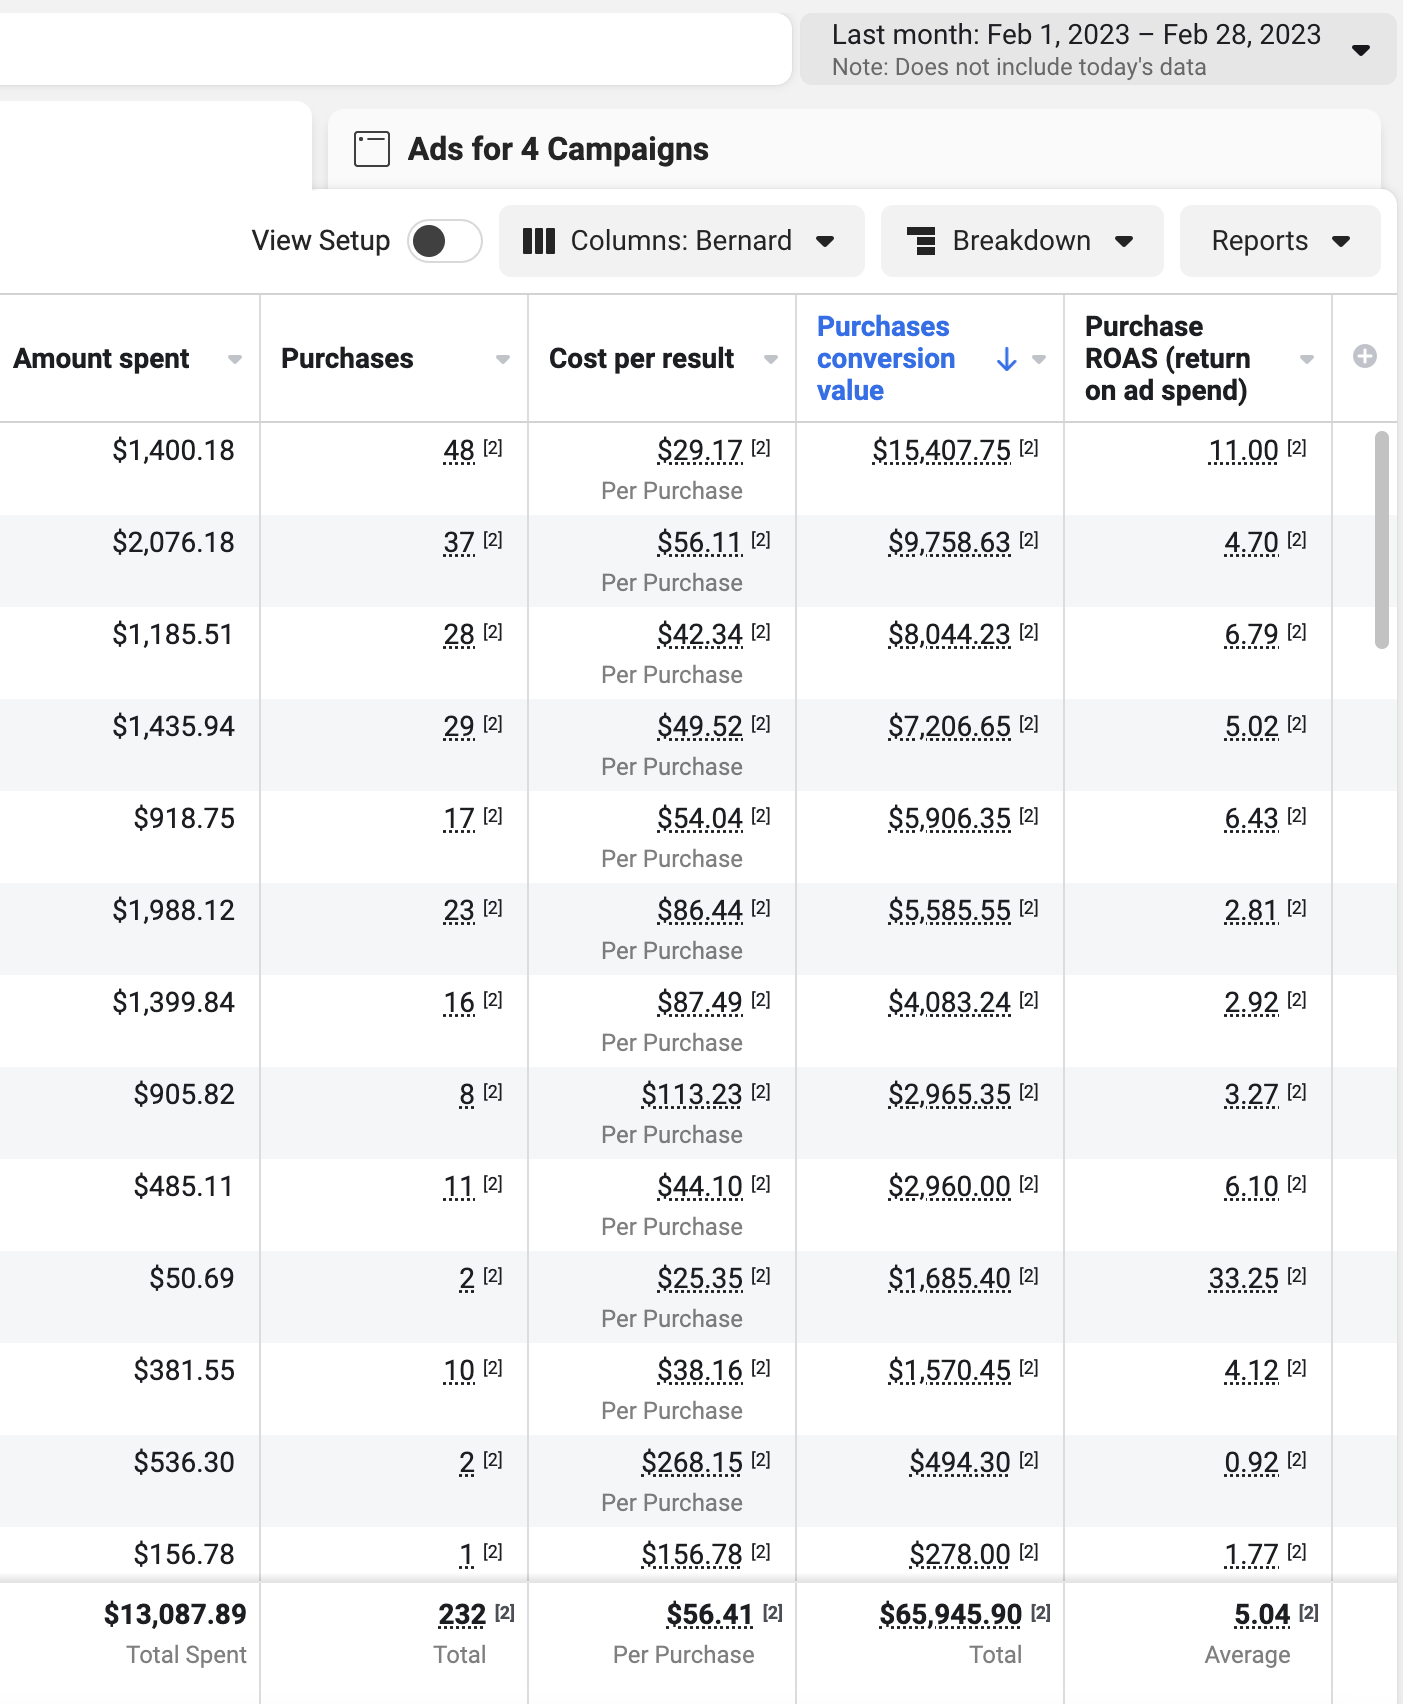
$65.9K Revenue from $13K Spend — 5.04x ROAS (Feb 2023)
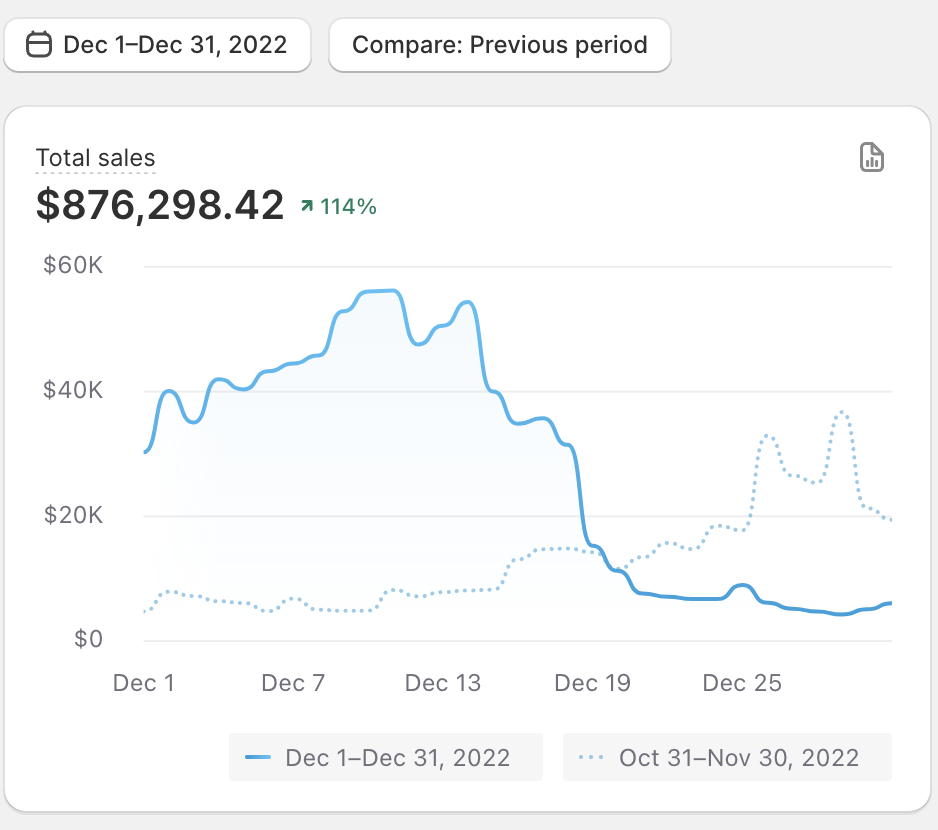
$876K Sales in December 2022 — ↑114% MoM
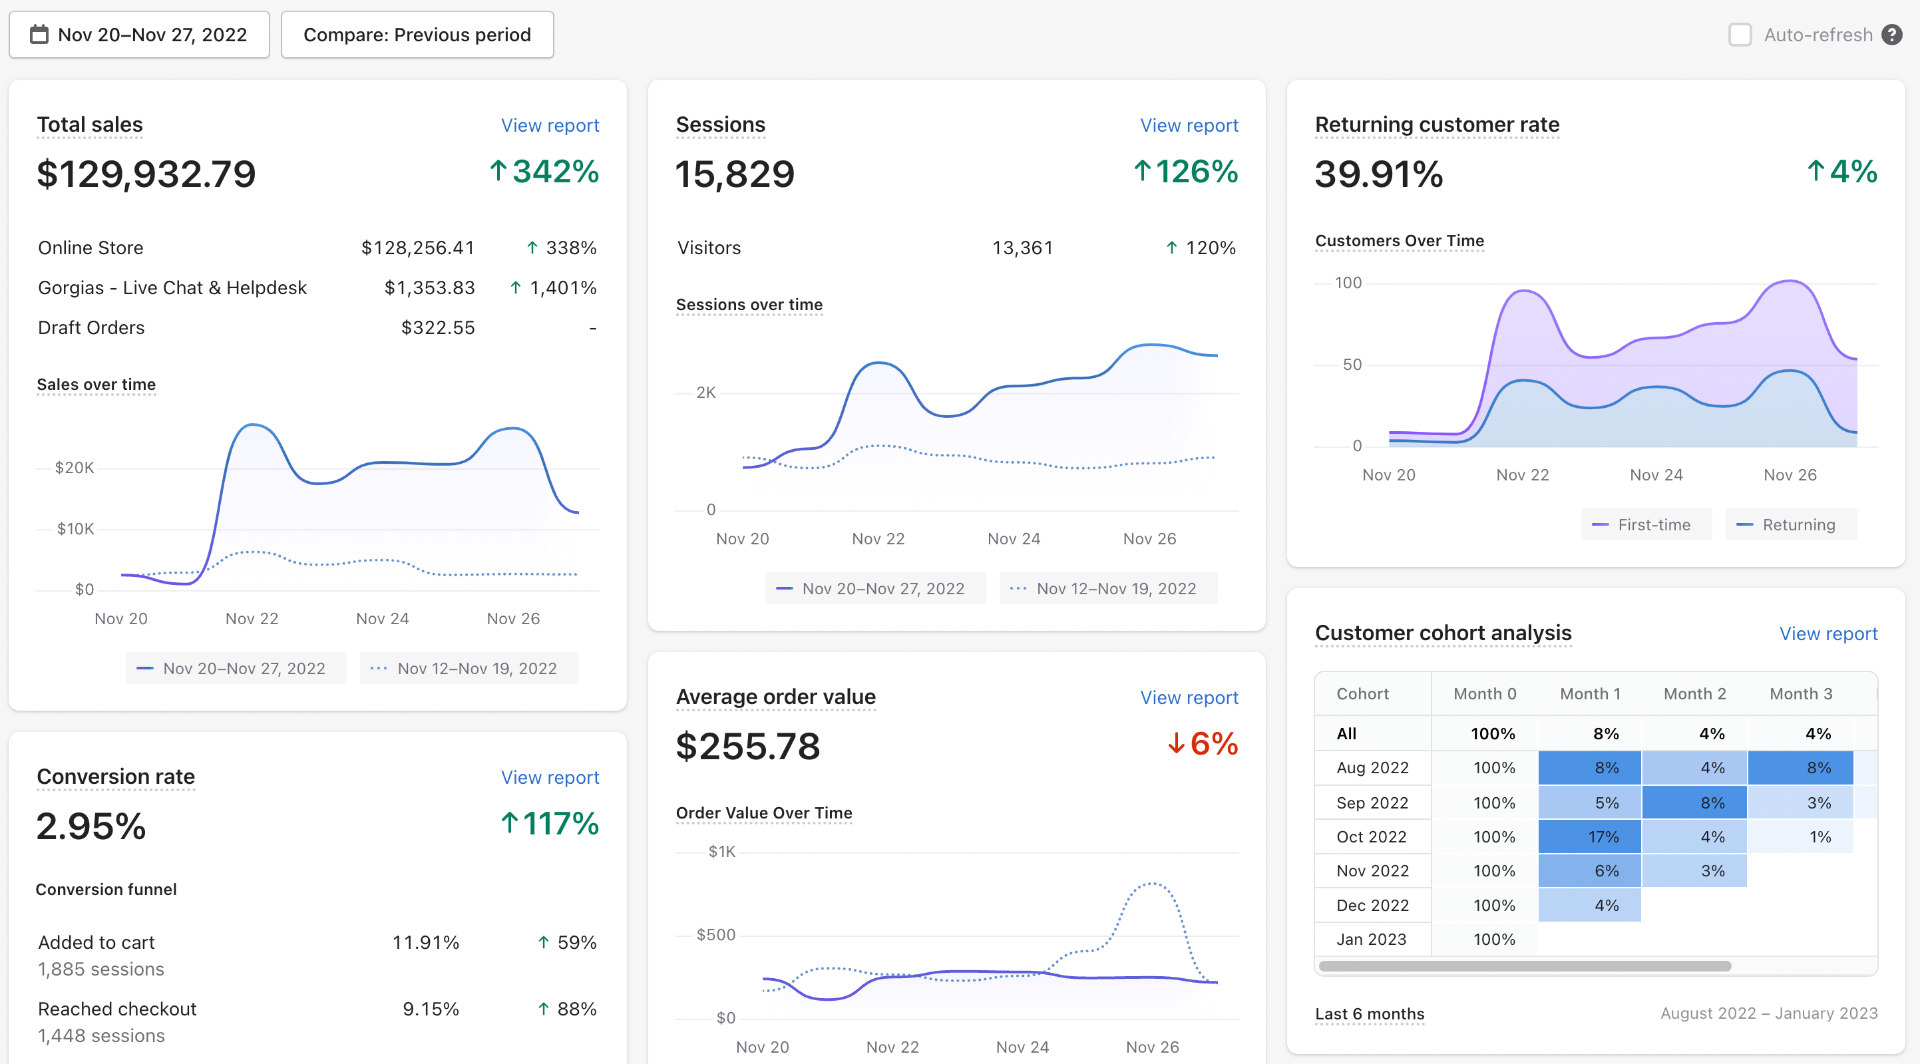
$129K BFCM Week — ↑342% YoY
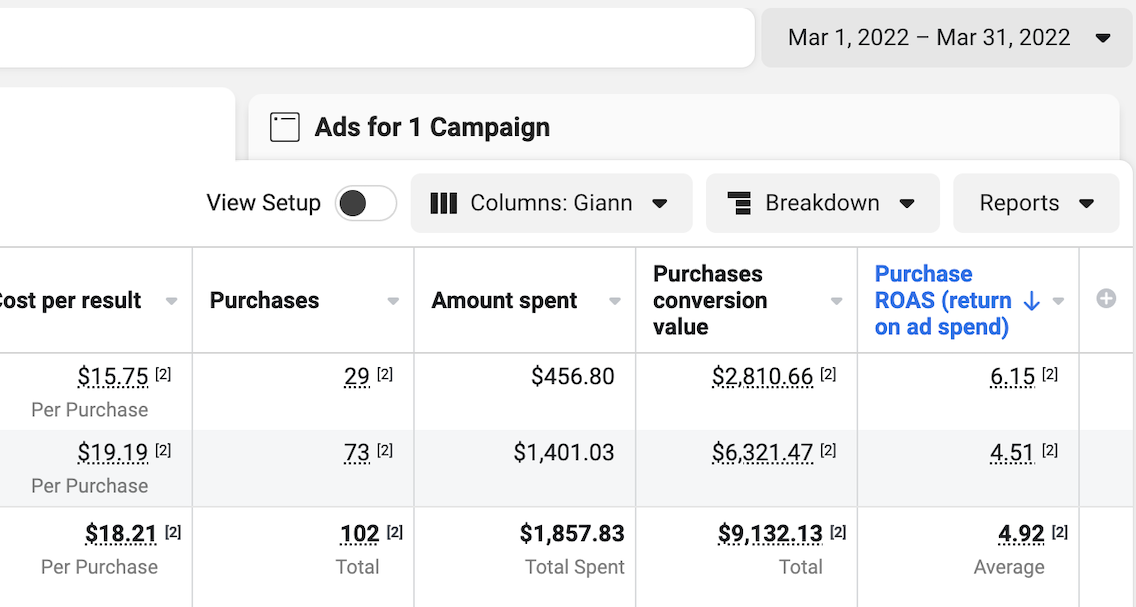
$9.1K Revenue from $1.8K Spend — 4.92x ROAS (Mar 2022)
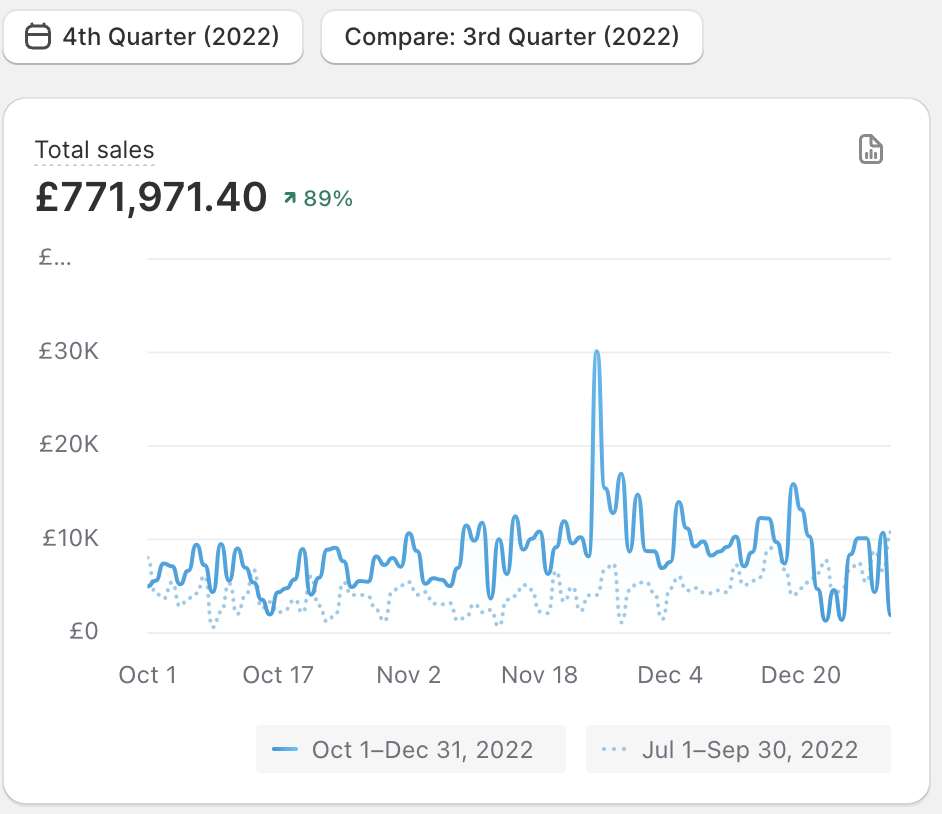
£771K Sales in Q4 2022 — ↑89% QoQ
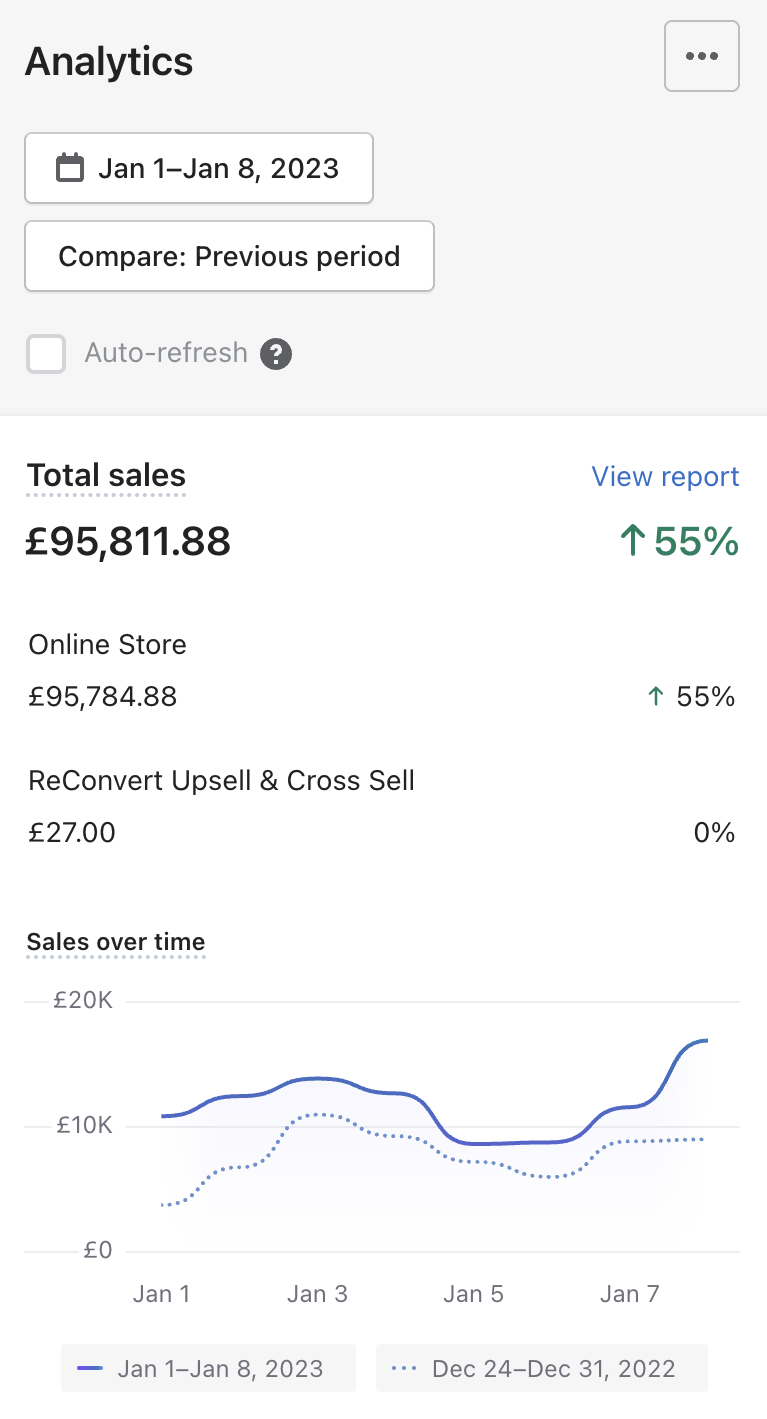
£95K First Week of January 2023 — ↑55%
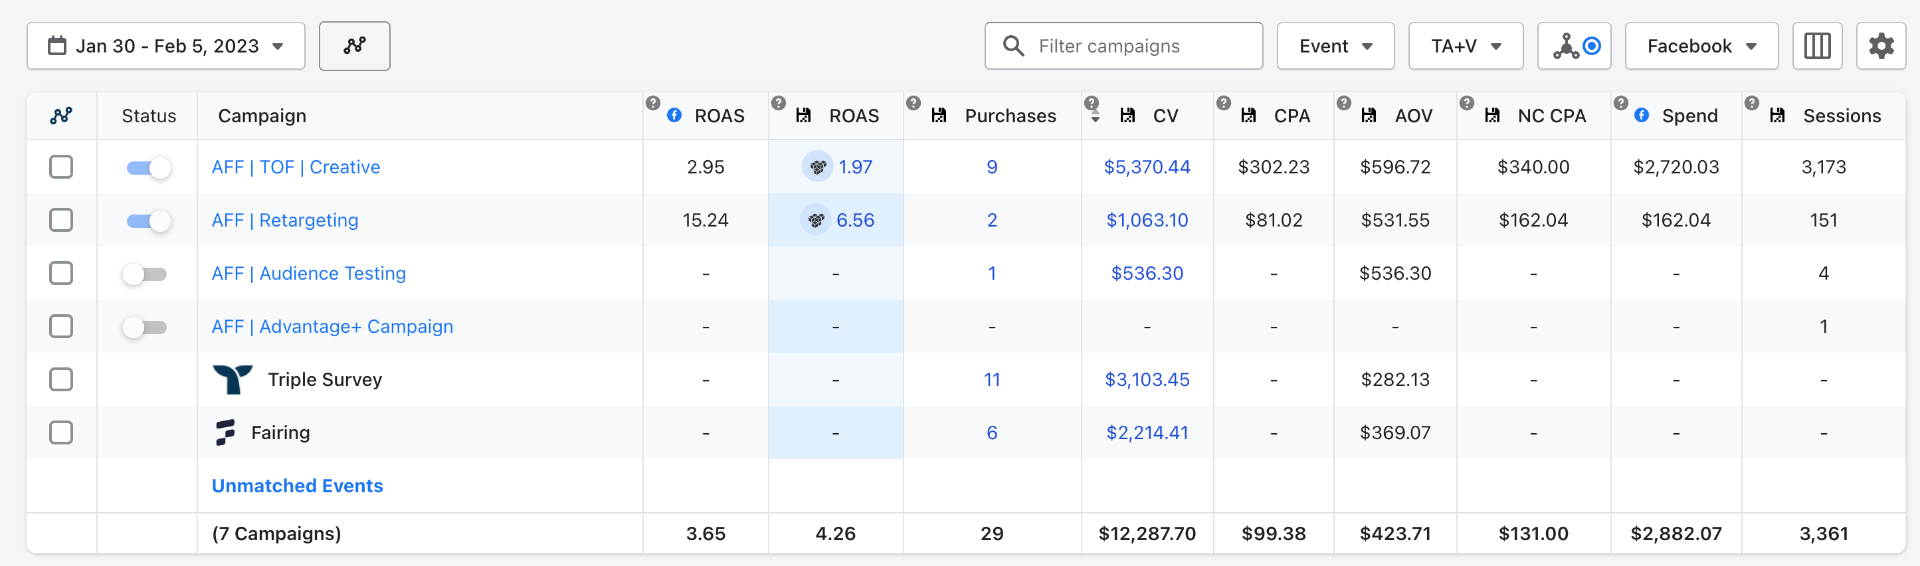
$12.2K CV — 4.26x ROAS (Facebook, 1 Week)
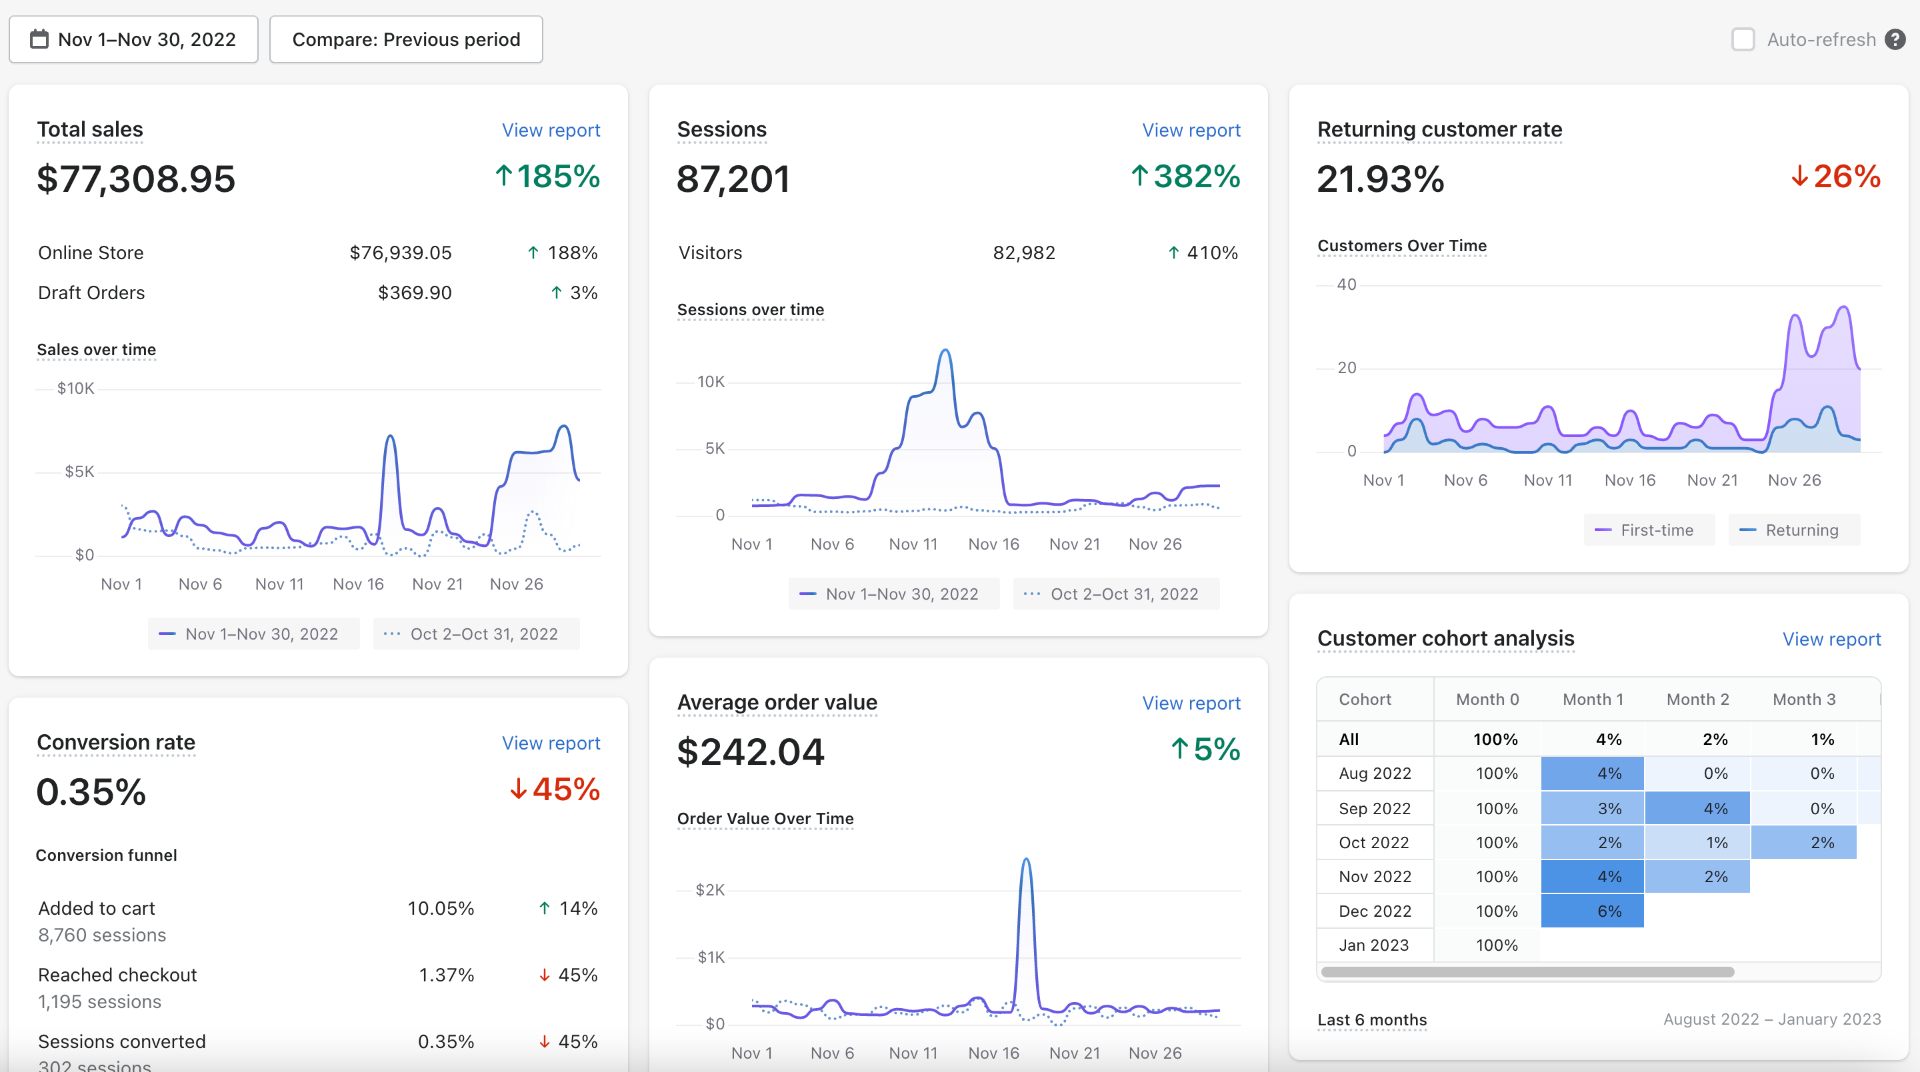
$77K November 2022 — ↑185% ($242 AOV)
£92K BFCM Fortnight — ↑110% (Nov 15–29, 2022)
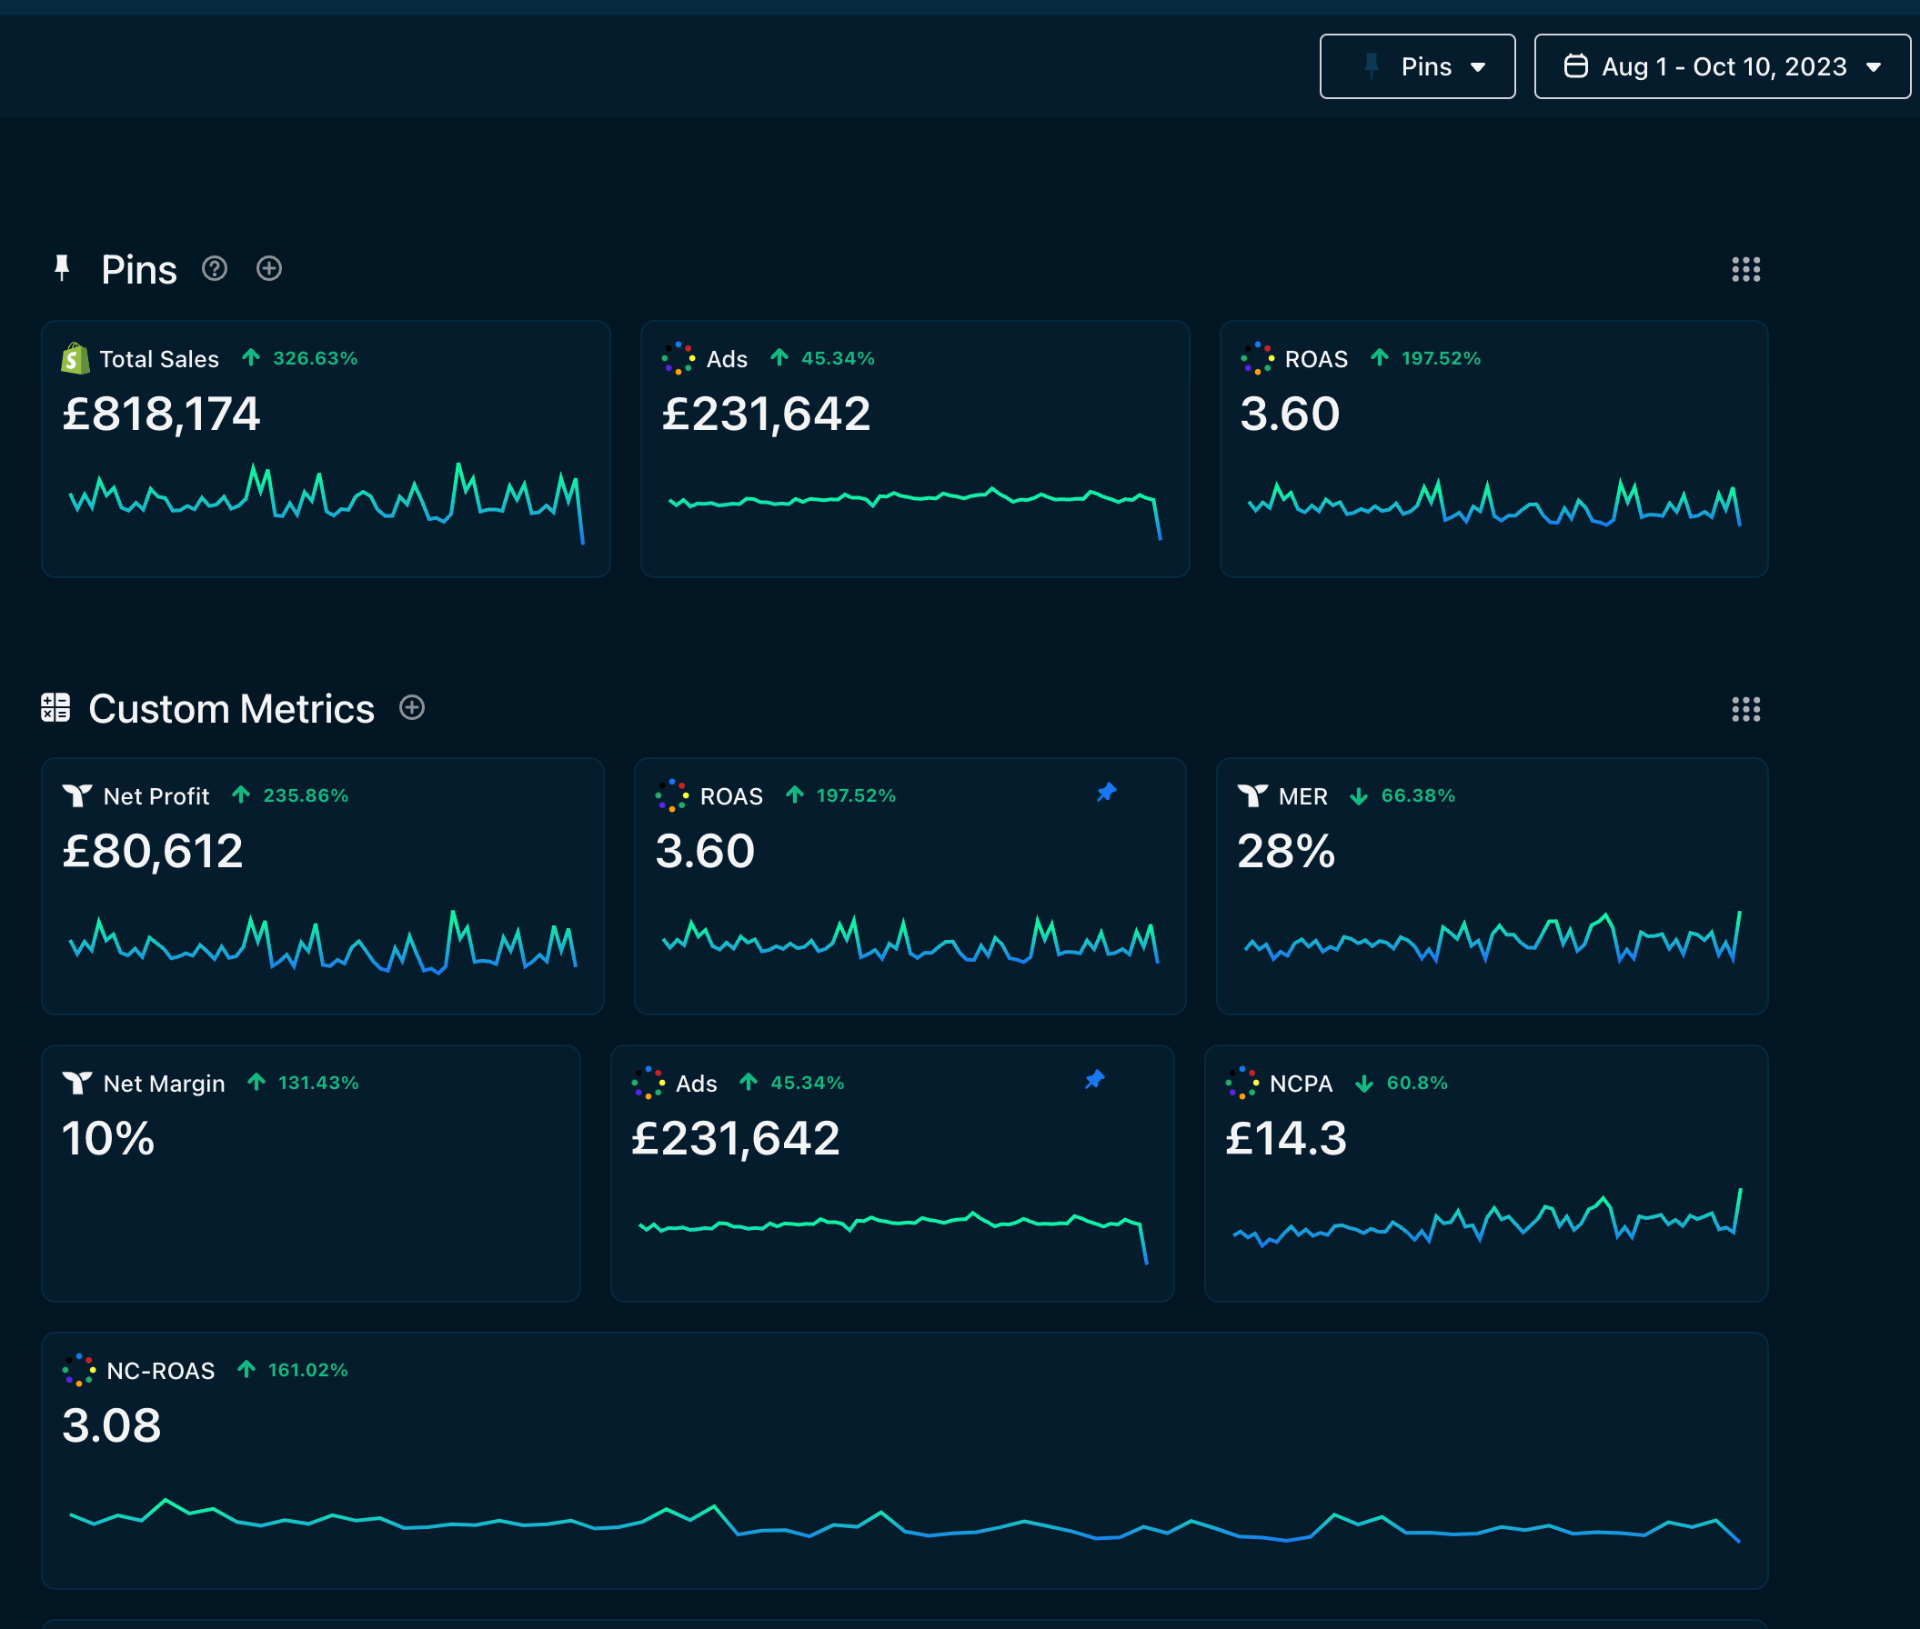
£818K Sales — 3.60 ROAS Dashboard
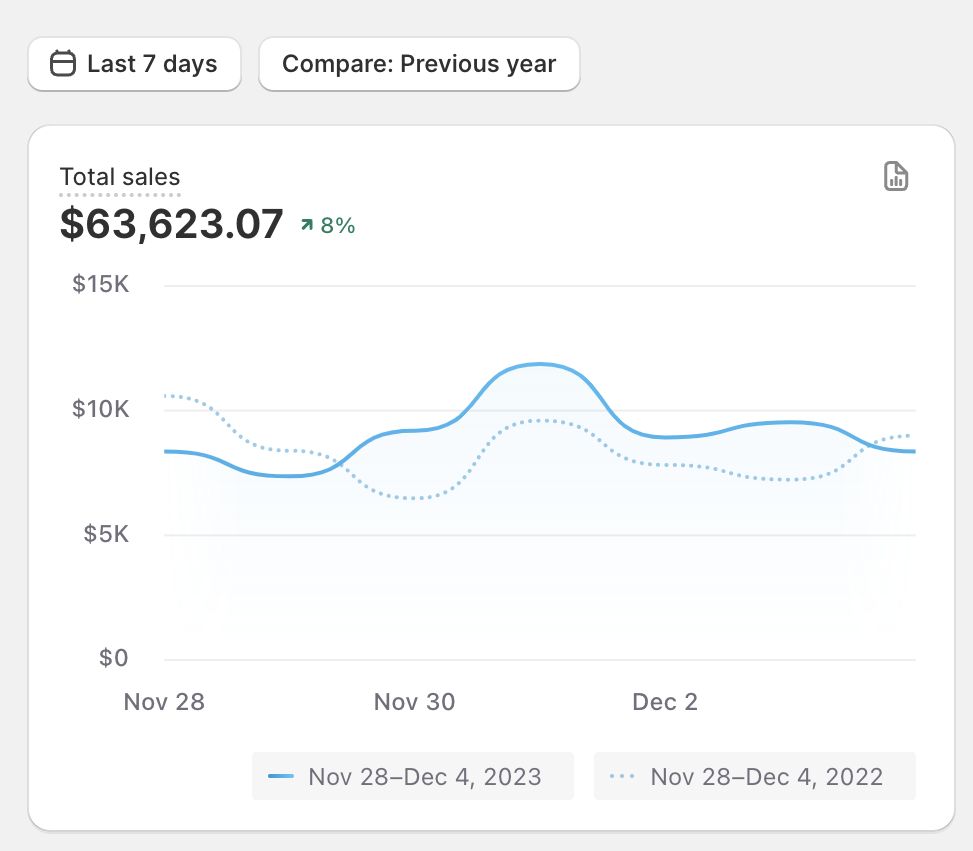
$63.6K Sales in 7 Days — ↑8% YoY
£92K BFCM Fortnight — ↑110% (Mobile View)
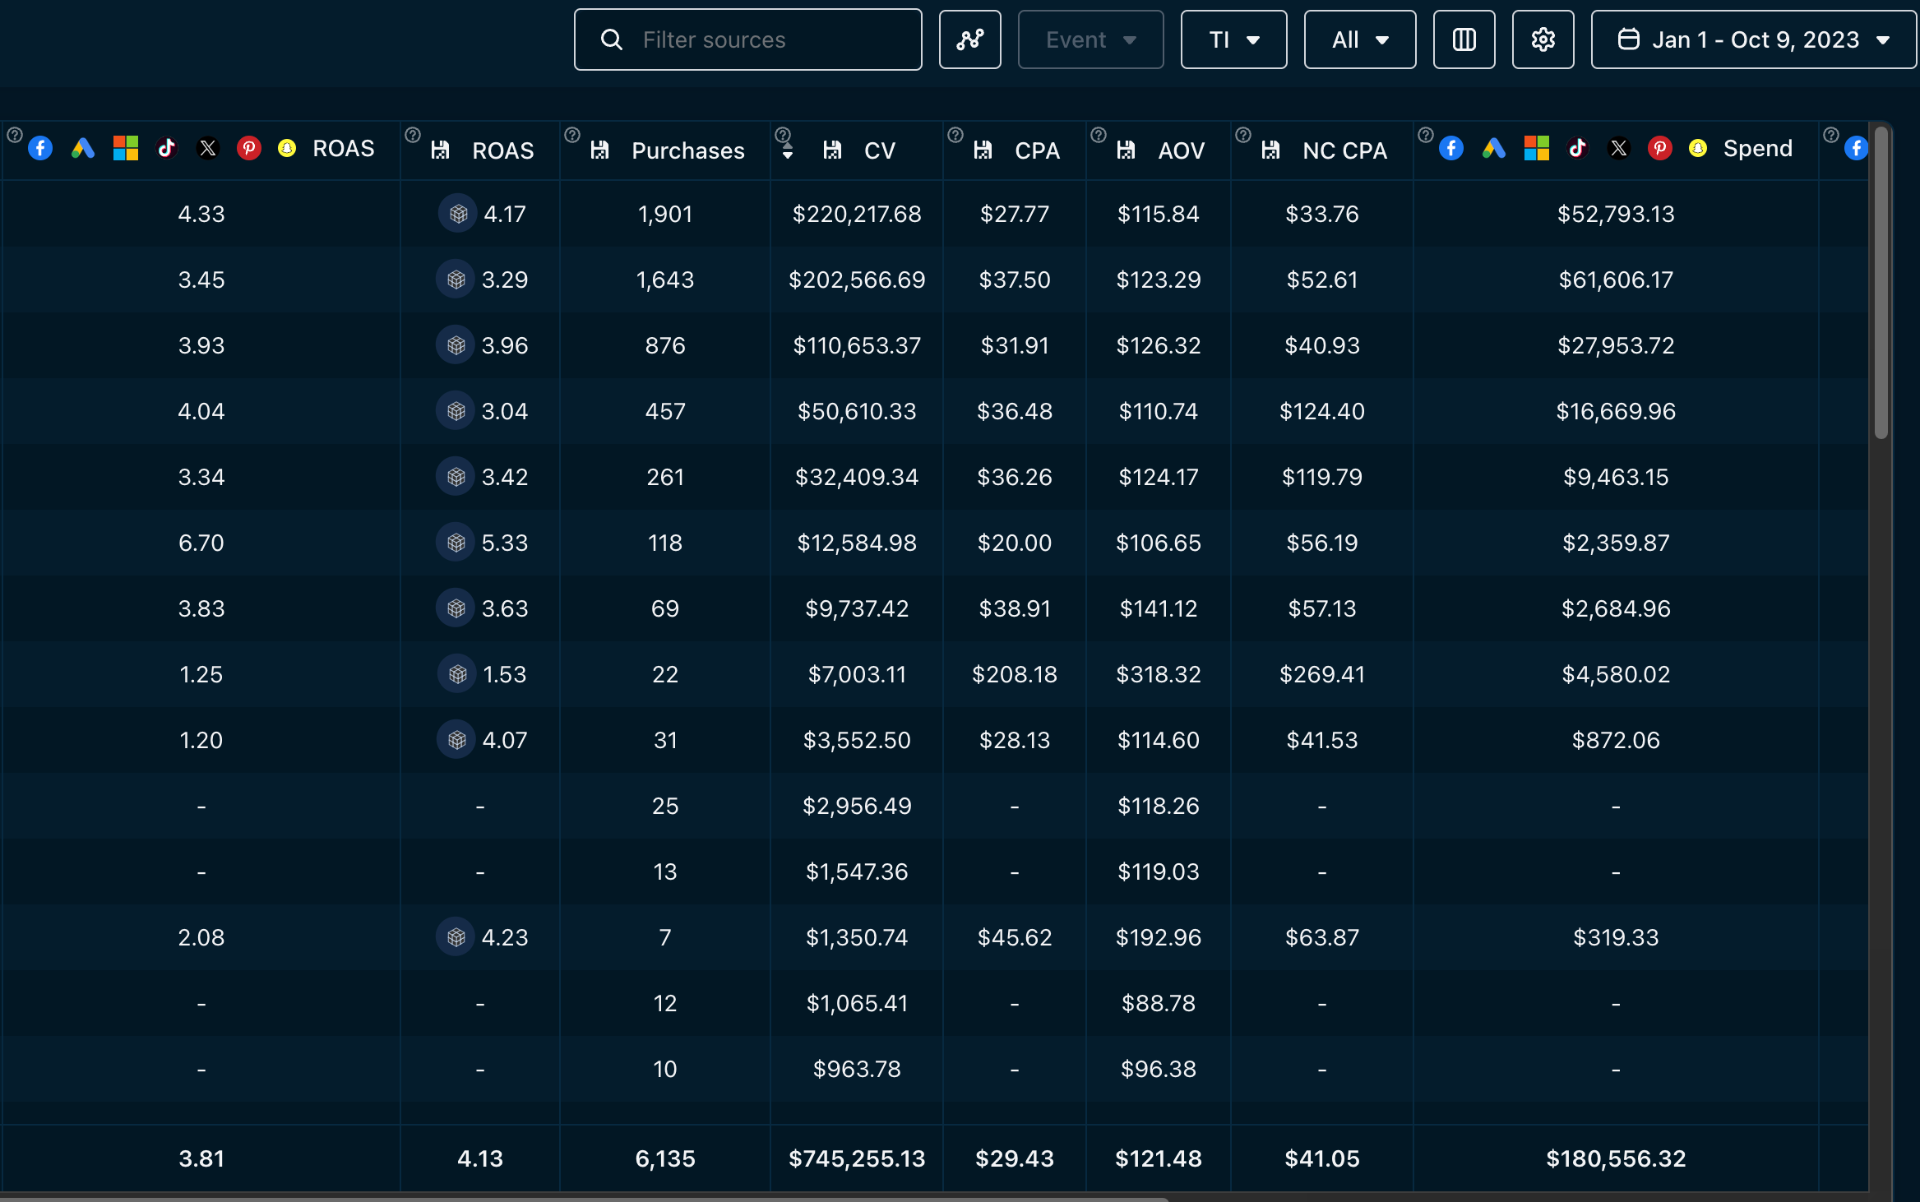
$745K Revenue — 4.13 ROAS (Omni-Channel)
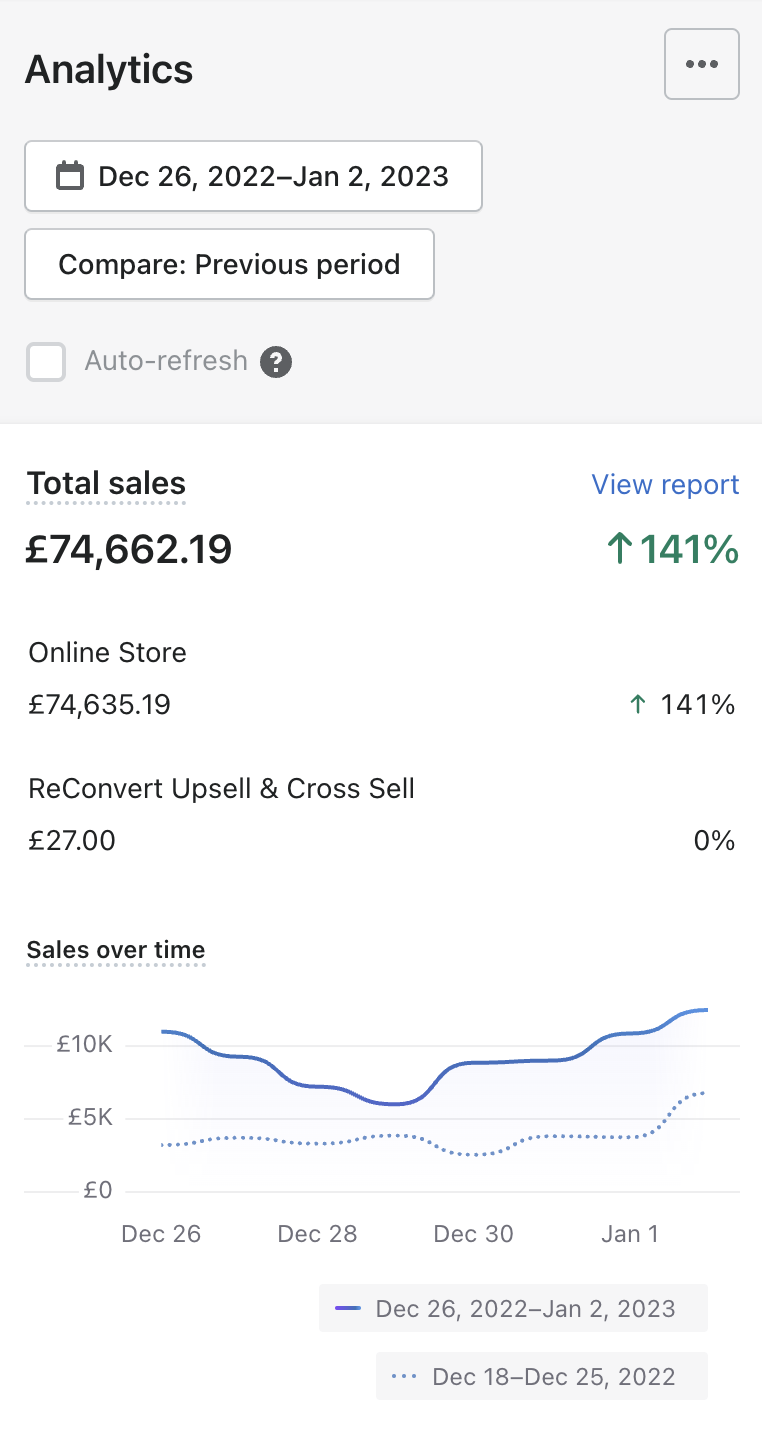
£74K Christmas Week — ↑141% (Dec 26 – Jan 2)
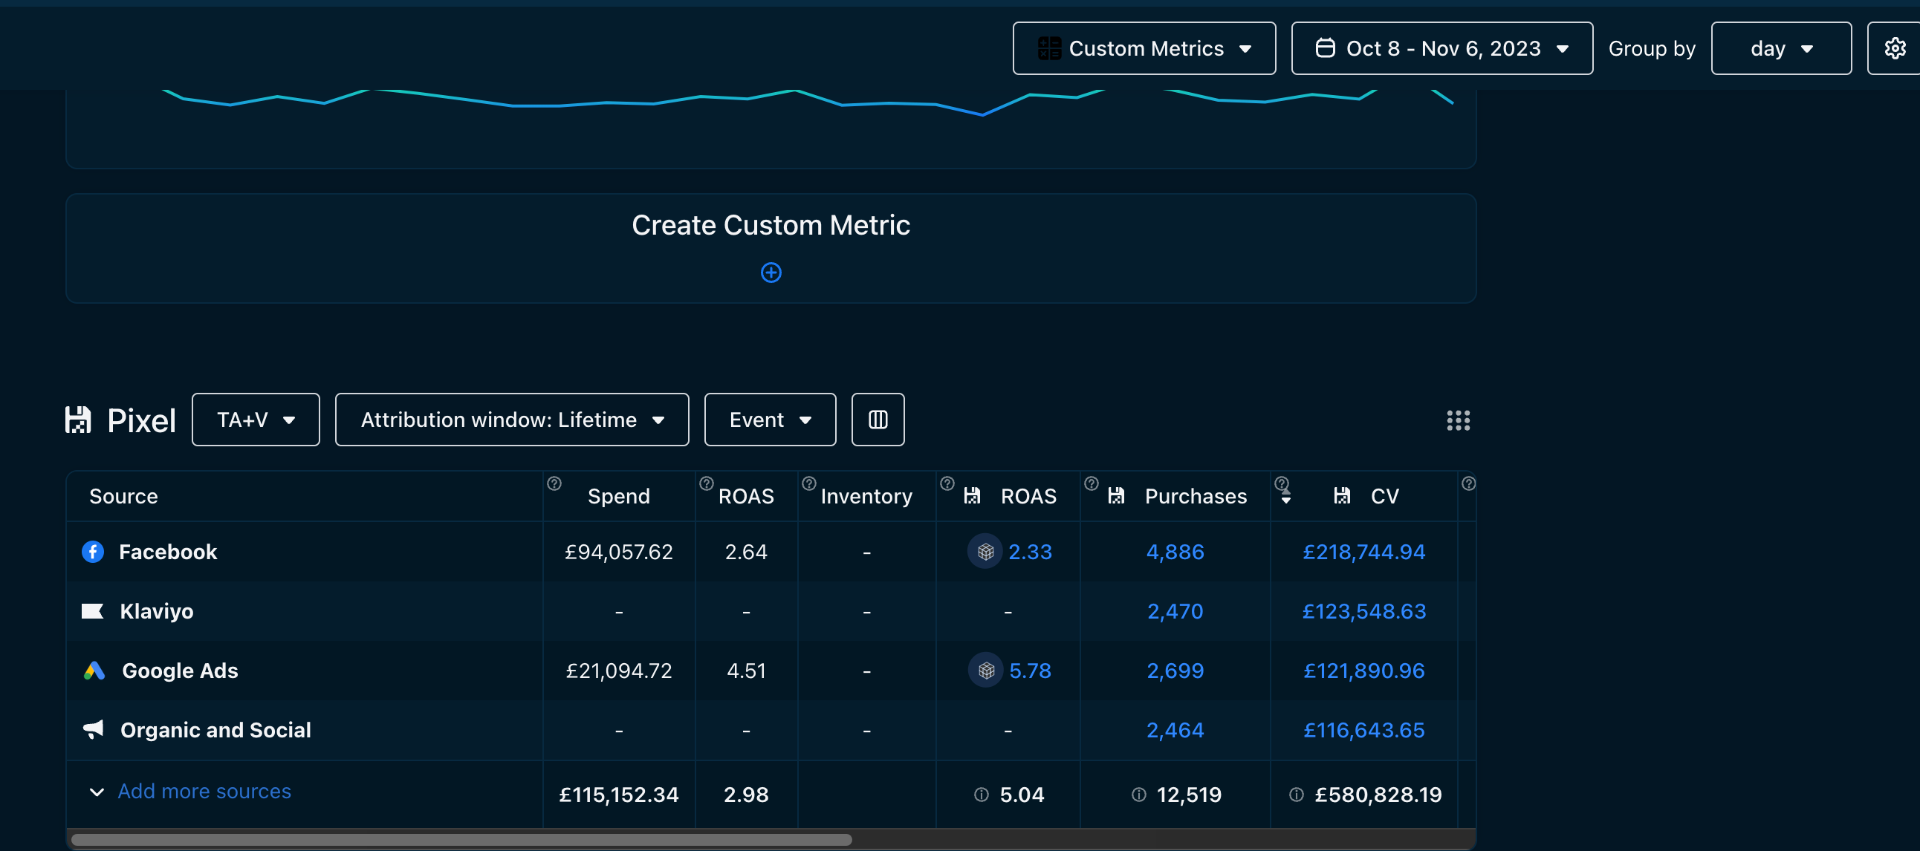
£580K Revenue — 5.04 ROAS (Multi-Channel)
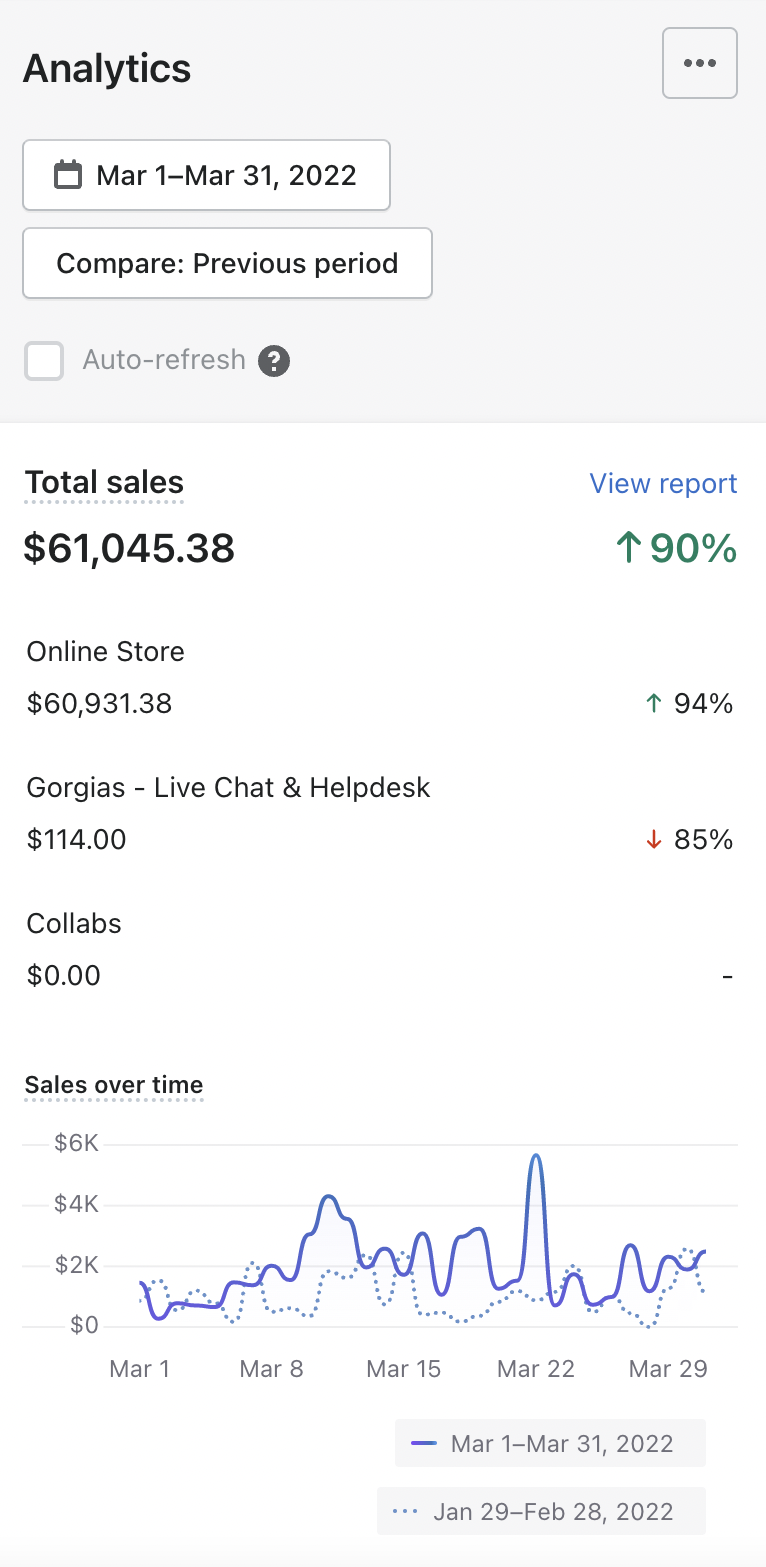
$61K March 2022 — ↑90% (Mobile View)
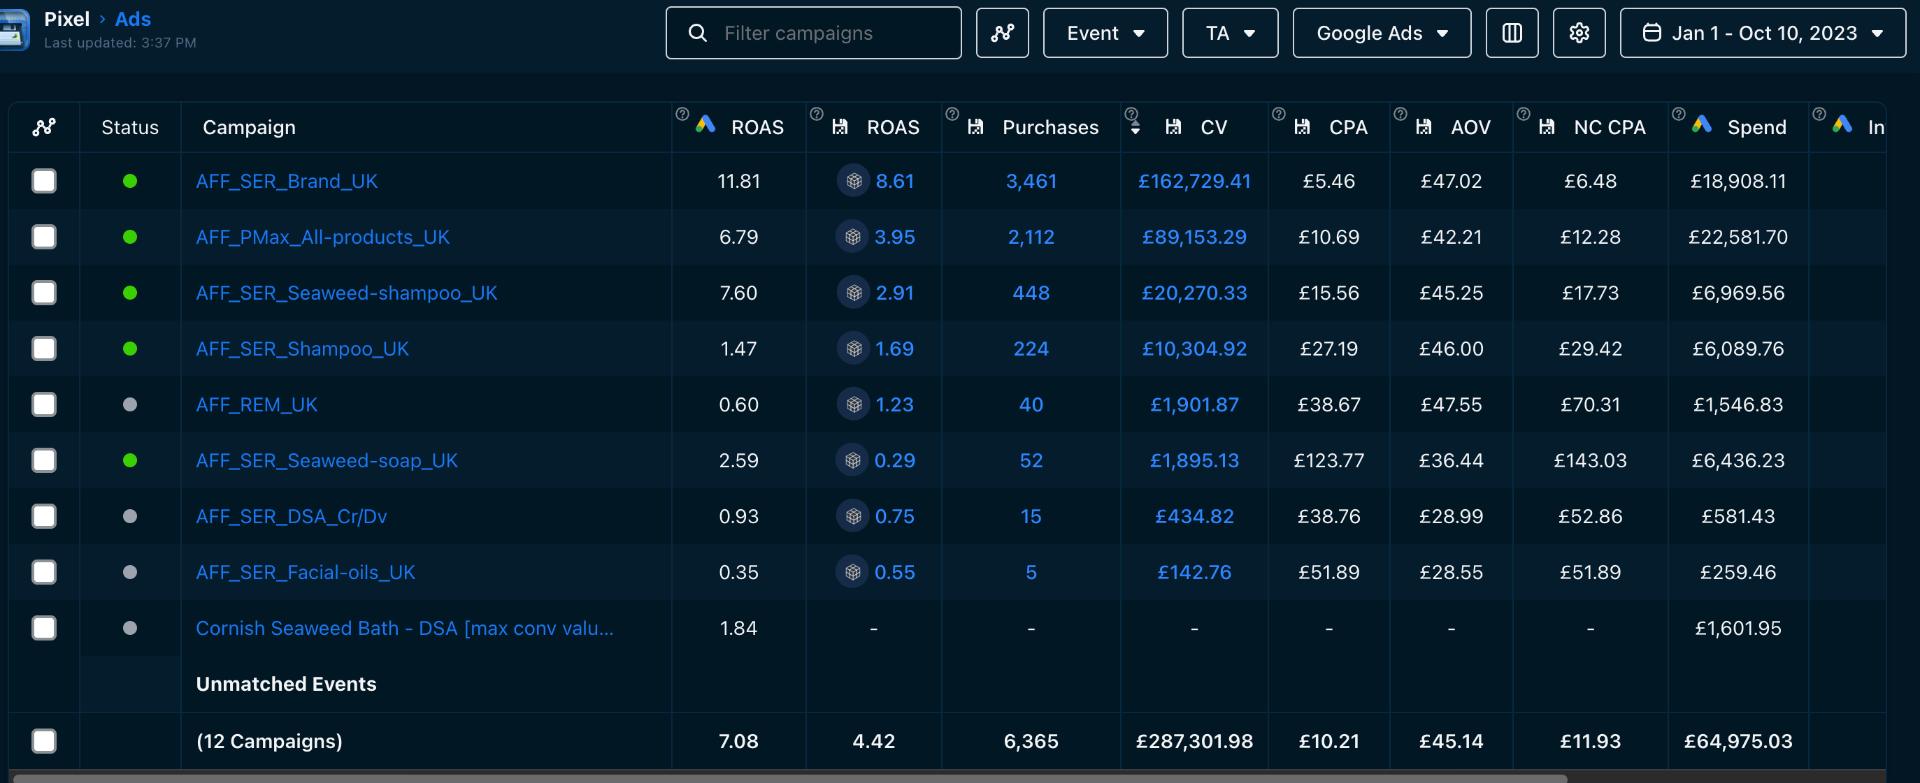
£287K Revenue — 4.42 ROAS (Google Ads)
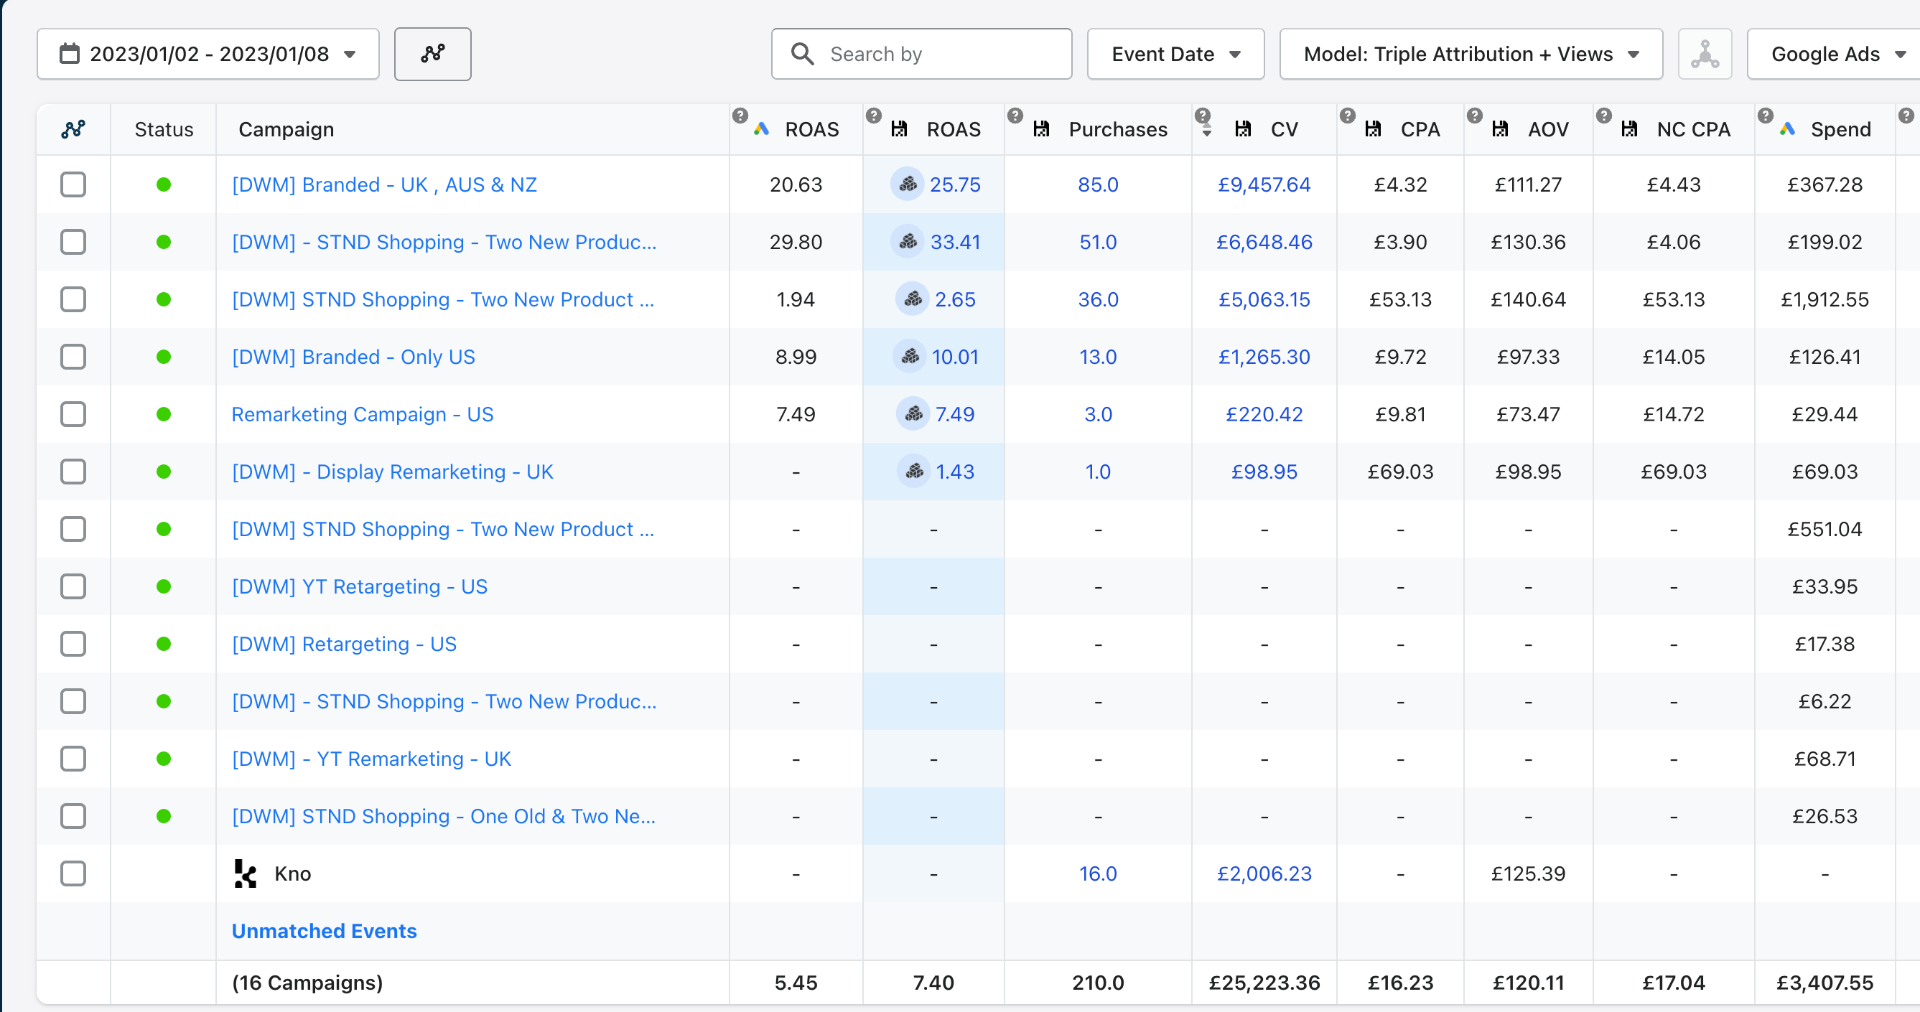
£25K Google Ads — 7.40x ROAS (210 Purchases, 1 Week)
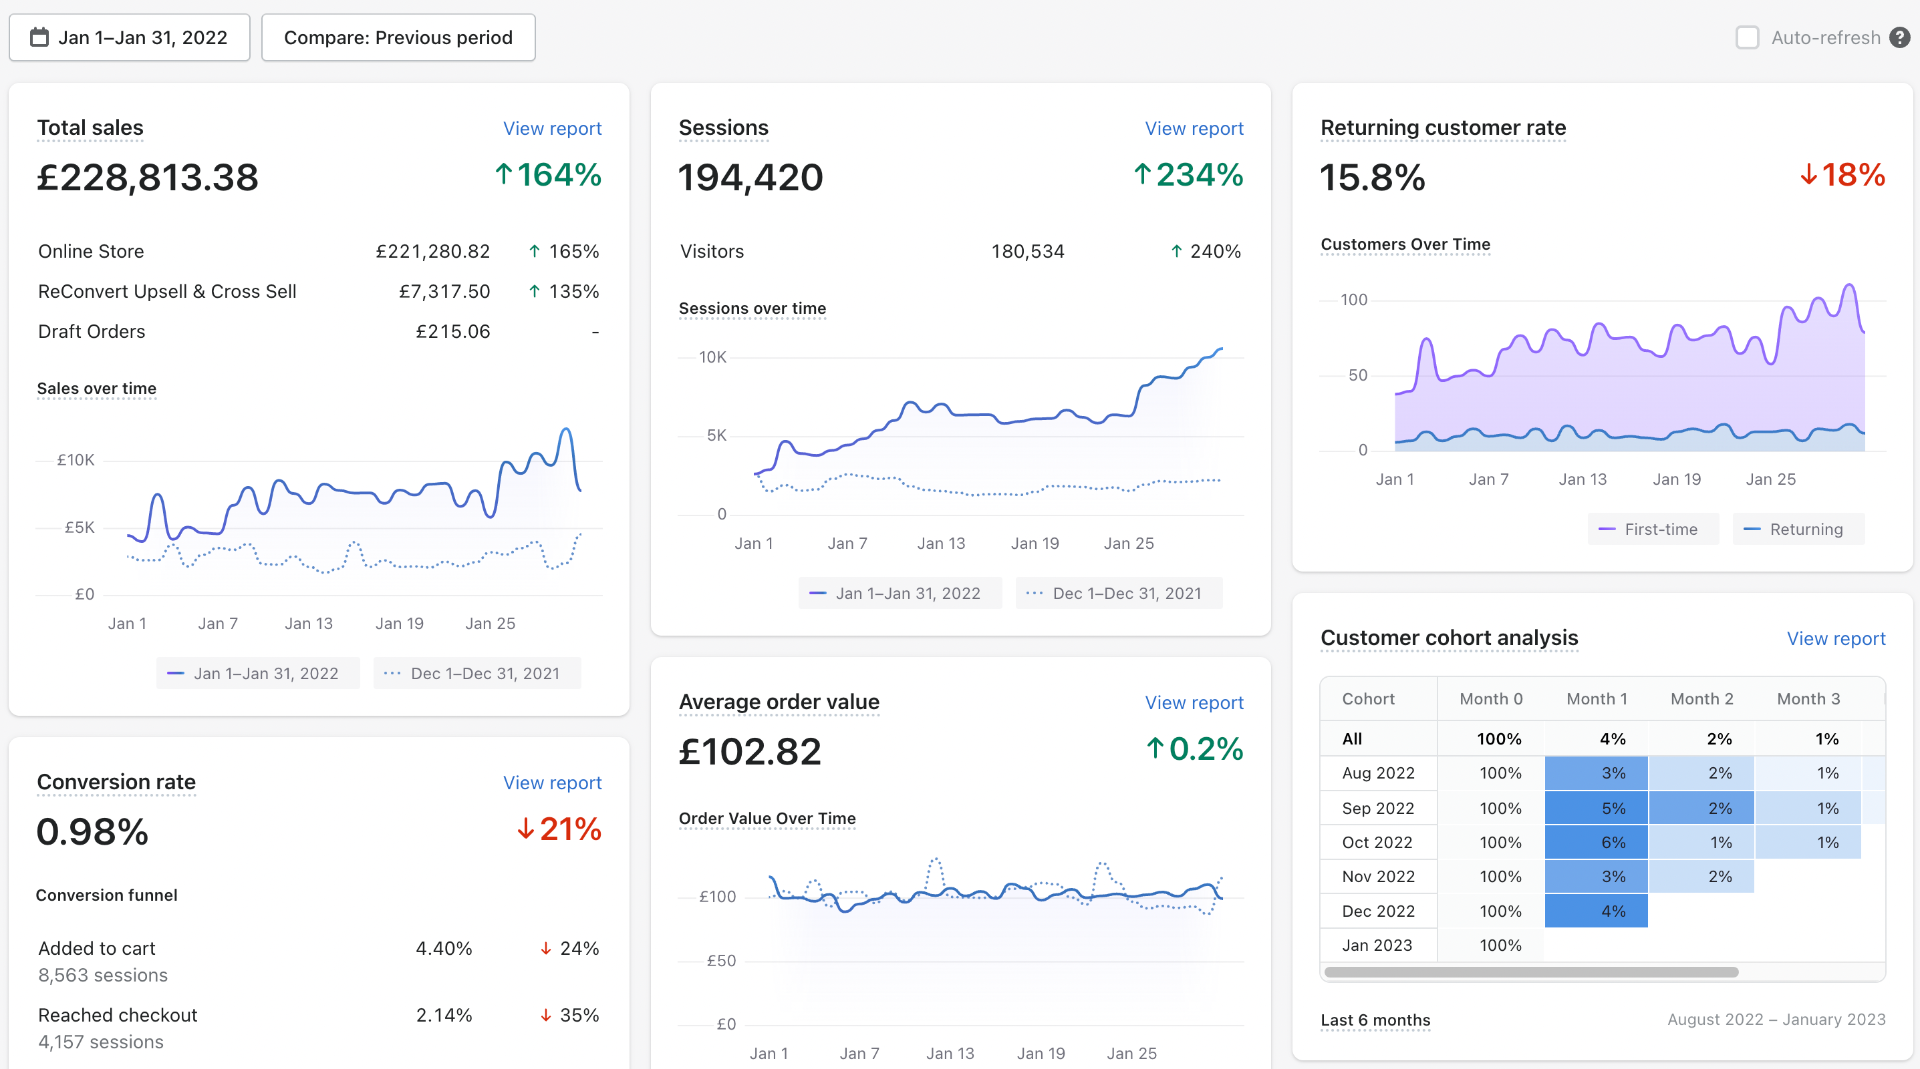
£228K January 2022 — ↑164% (194K Sessions)
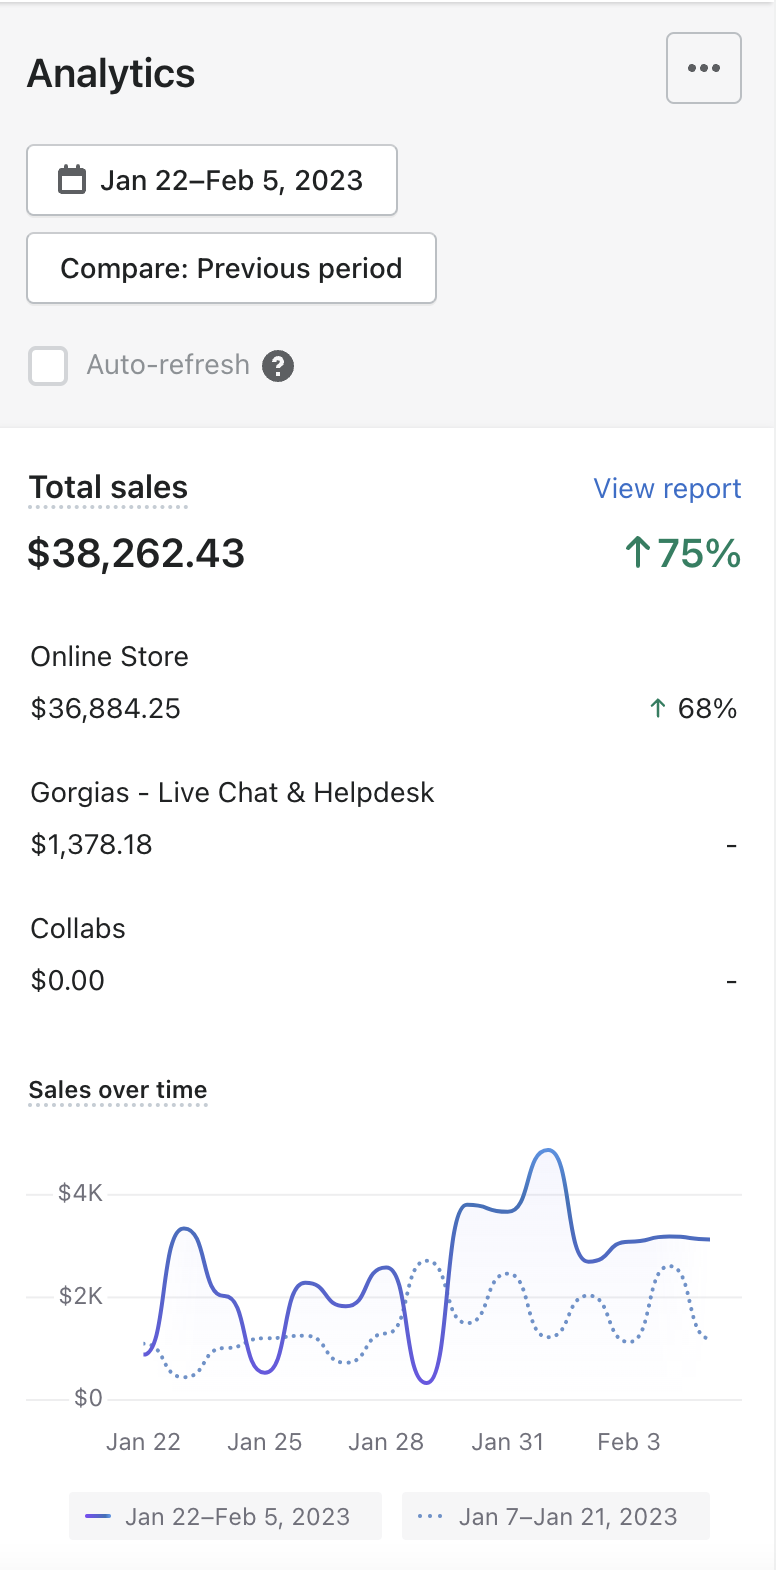
$38K in 2 Weeks — ↑75% (Jan 22 – Feb 5, 2023)
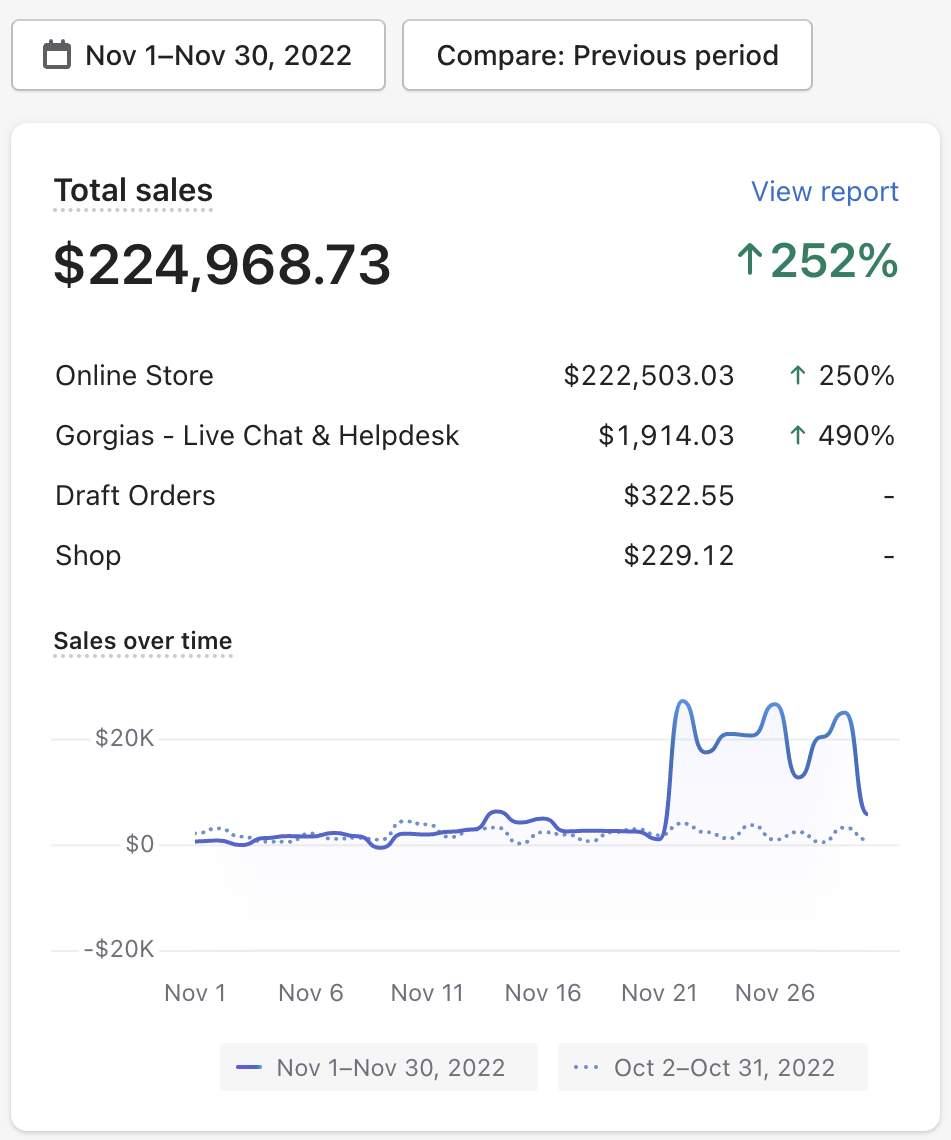
$224K November 2022 — ↑252% MoM
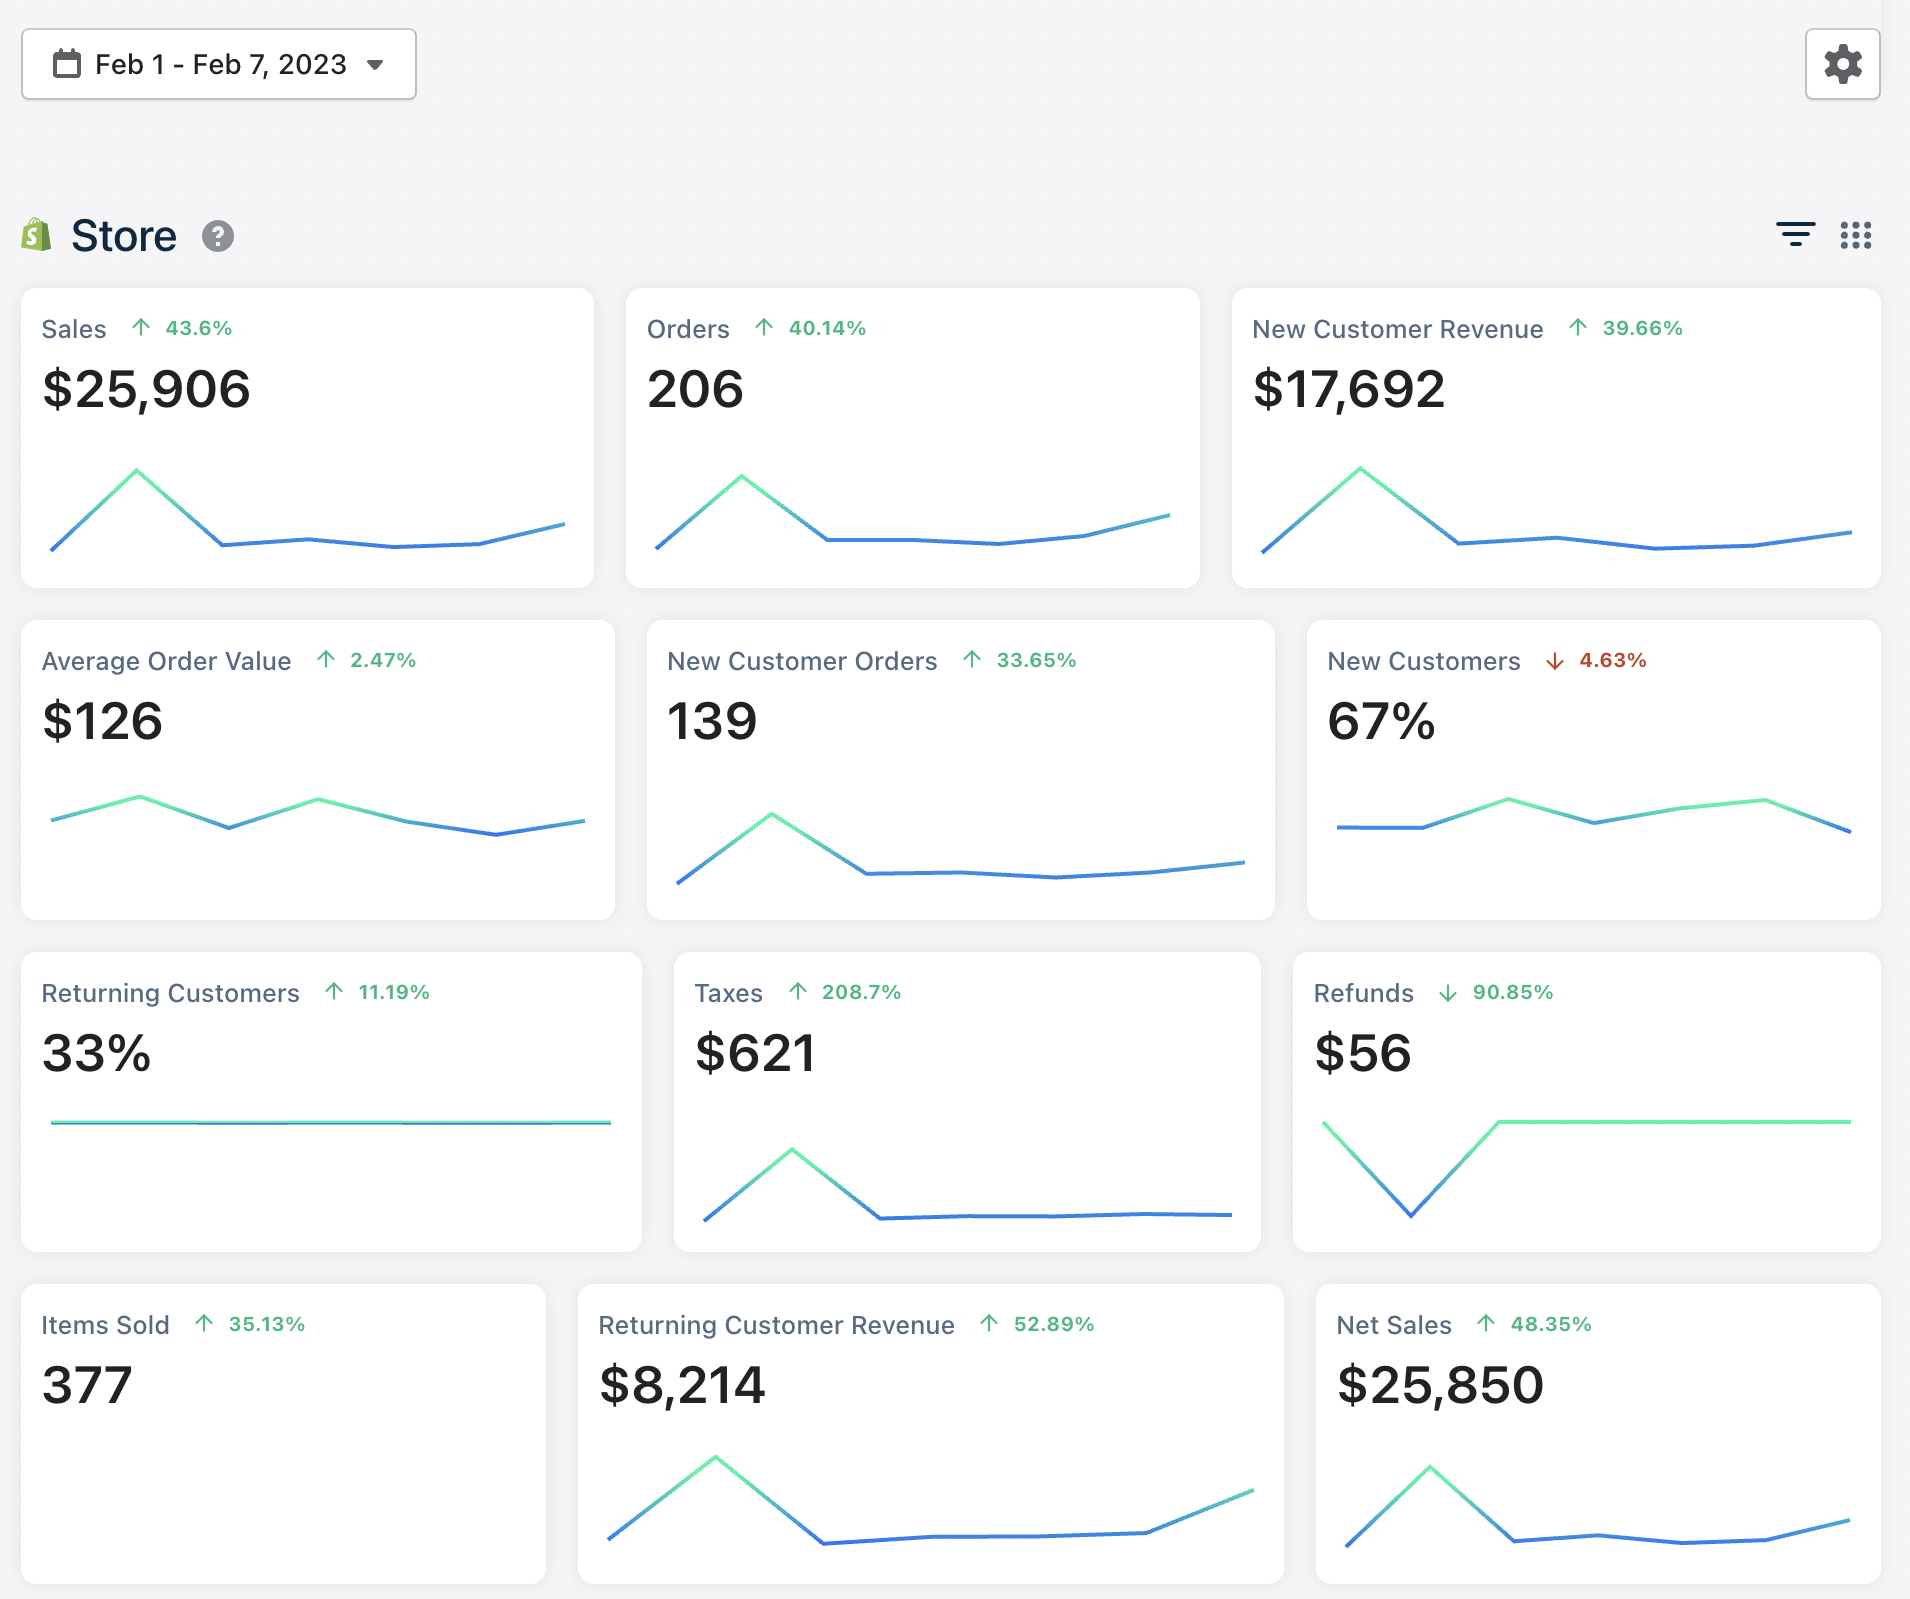
$25.9K Weekly Sales — ↑43% (Triple Whale, Feb 2023)
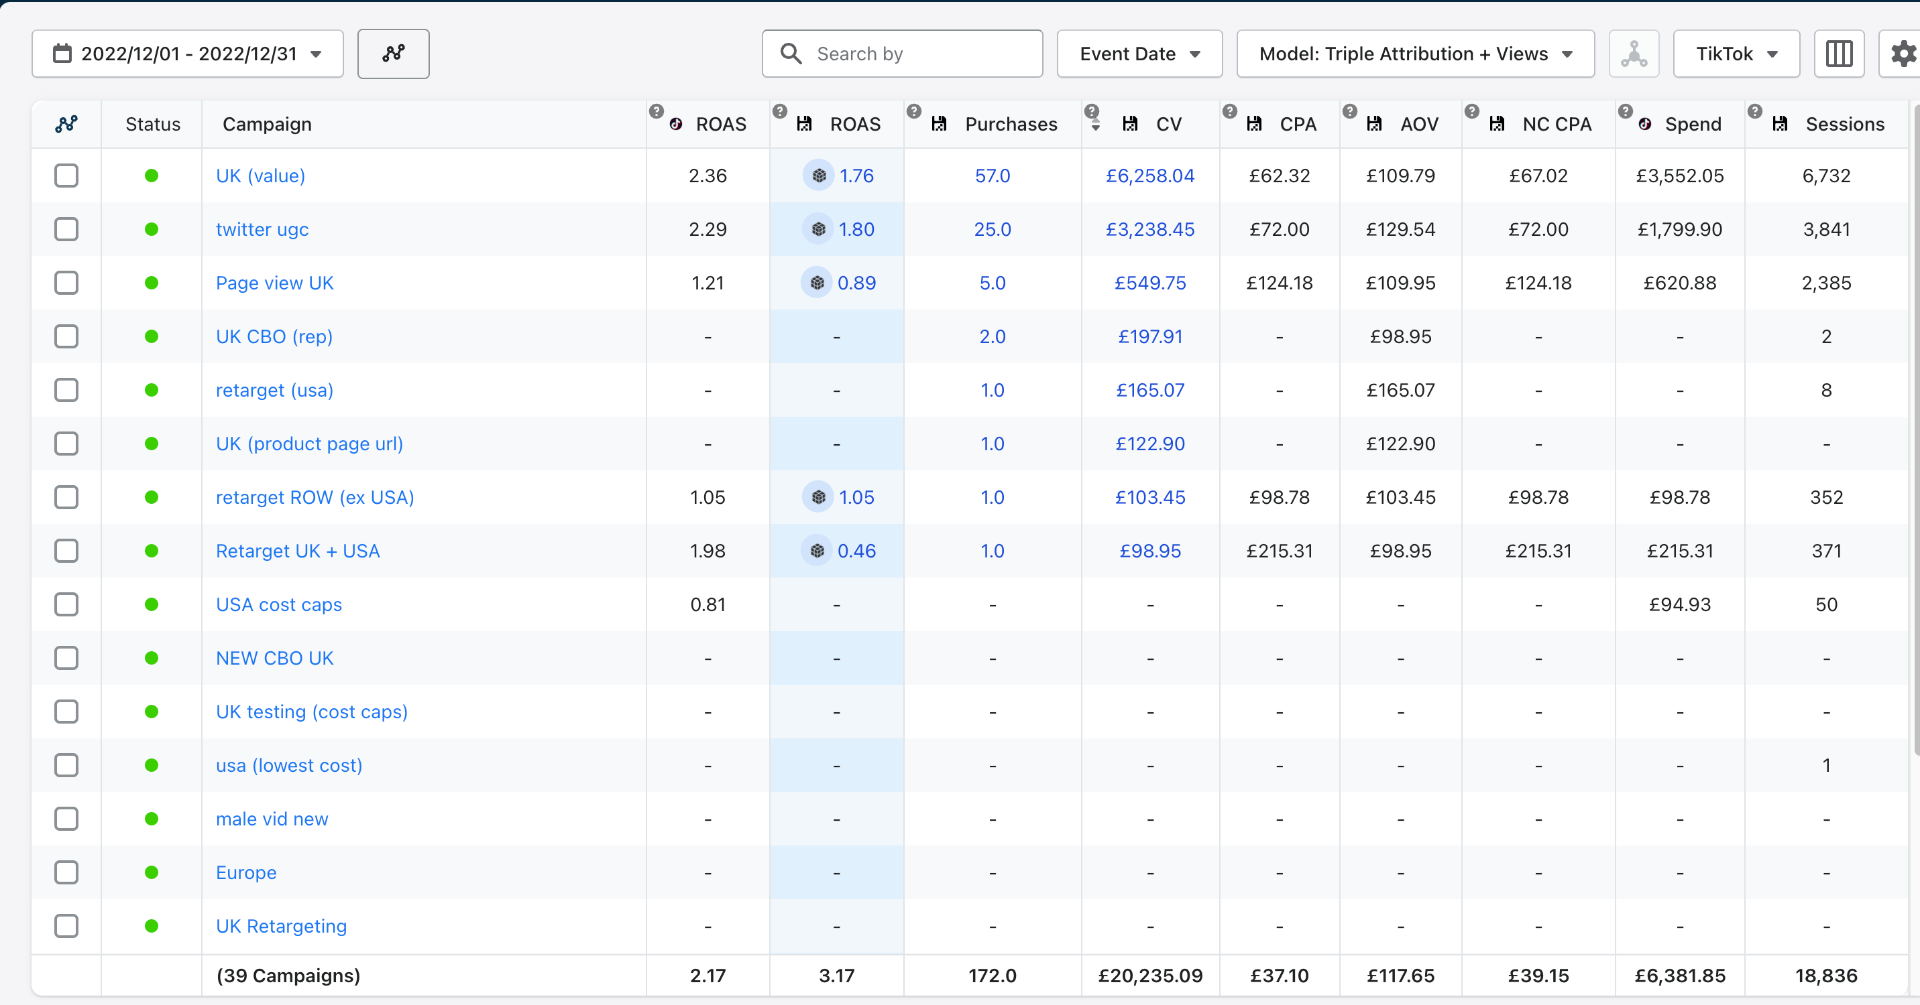
£20K TikTok CV — 3.17x ROAS (172 Purchases, Dec 2022)
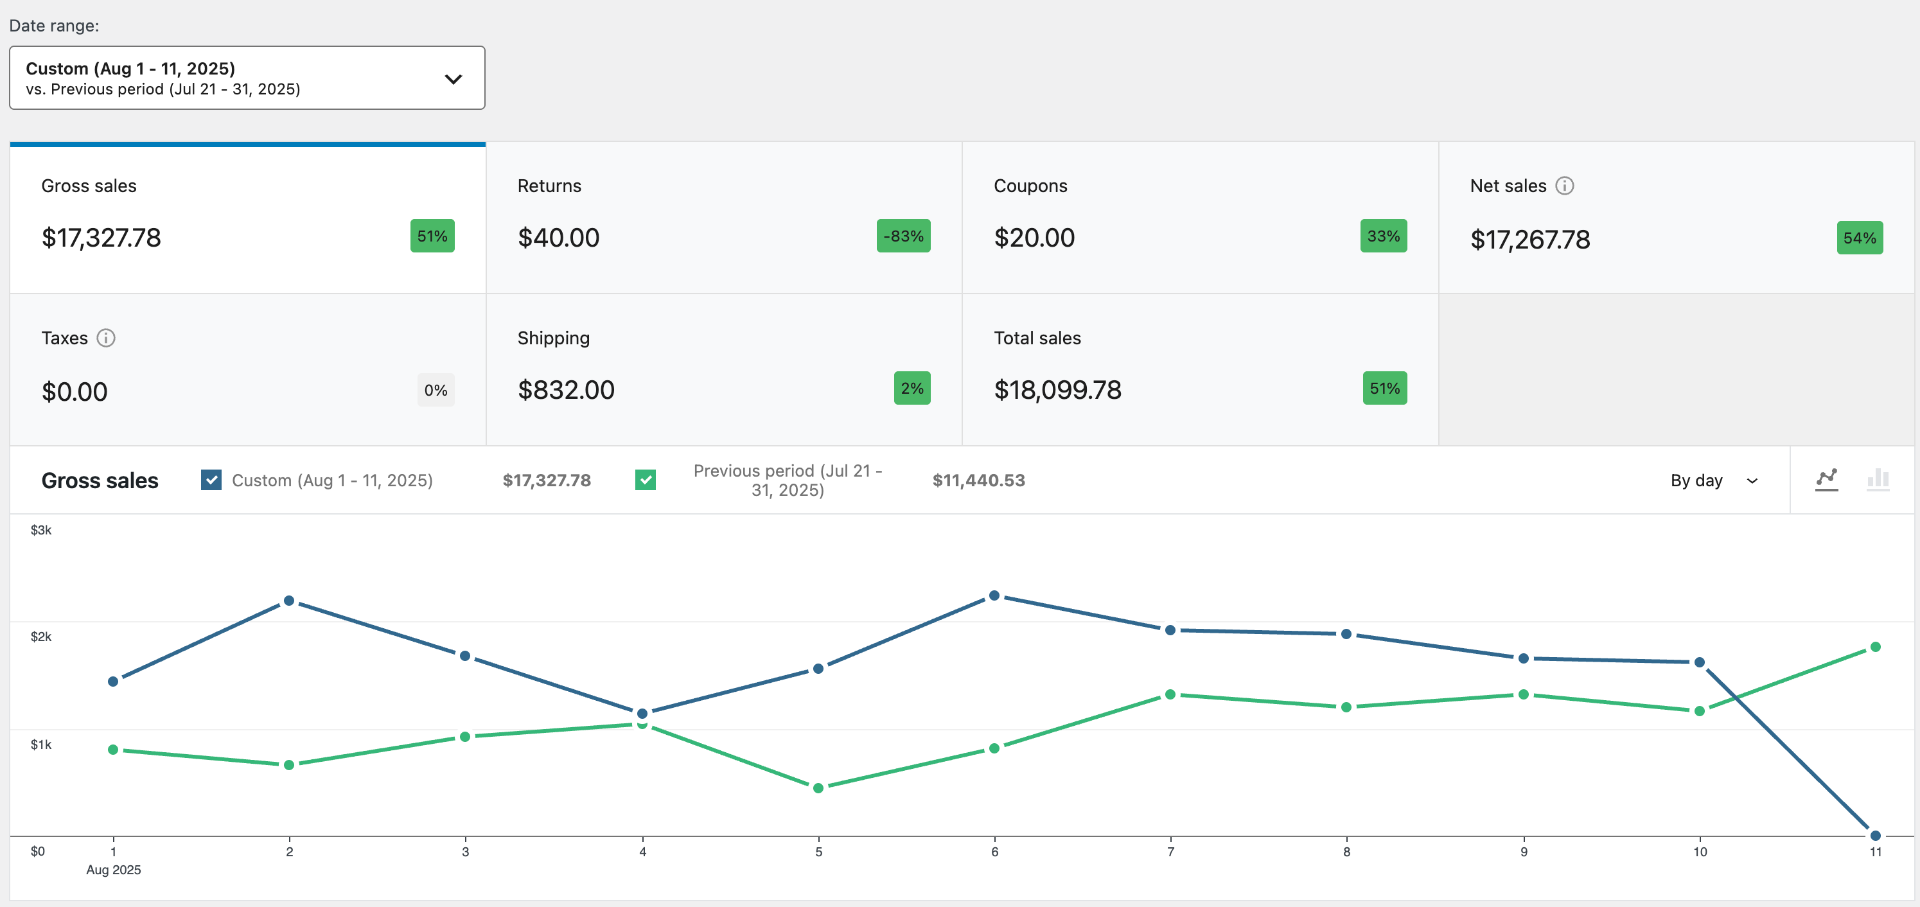
Shopify — $17.3K Gross Sales (Aug 1–11, 2025) +51%
Results are not typical or guaranteed and depend on operator effort, close rate, offer, and pricing. Niche labels indicate the vertical each result best maps to; cross-niche results apply broadly across high-ticket service and DTC businesses.
One System. Every High-Ticket Service.
If you sell something high-ticket — online or at the kitchen table — and you're spending on Meta to get it, the proof above is your proof too. A snapshot of the universe we operate across:
- Roofing & Solar
- HVAC & Plumbing
- Windows & Siding
- Kitchen & Bath
- Remodeling & Builders
- Pools & Outdoor
- Personal Injury
- Mass Tort & Class Action
- Family Law & Divorce
- Estate Planning
- Criminal Defense
- Immigration
- Med Spas & Aesthetics
- Dental & Implants
- TRT & Hormone
- Weight-Loss & GLP-1
- Regenerative & Peptide
- Longevity & Wellness
- Coaches & Consultants
- Course & Info-Product
- Tax & Financial
- Funded-Trader Coaches
- Mortgage & Lending
- B2B & Agencies
We Know You've Been Burned Before. So We Built The Opposite.
You've paid for "leads" that ghosted. You've sent your team out to prospects who never wanted to buy. You've heard every promise in the book. We get it. Here's what's actually going wrong.
- 1
Leads Are Not Appointments.
A name and a phone number is not revenue. Most agencies dump form-fills in a CRM and call it lead-gen. You still have to chase, qualify, and book. Most ghost.
- 2
Shared Leads Are Dead Leads.
By the time you call, three of your competitors already have. Whoever responds cheapest and fastest wins. Margins die. The customer gets a worse experience.
- 3
Offshore Reps Tarnish Your Brand.
Heavy accents. Scripted pitches. Zero understanding of your service or your market. The first impression of your company gets made by someone who's never done the work.
- 4
No Real Qualification = Wasted Capacity.
Tire-kickers. Wrong area. No budget. Not the decision-maker. Your team burns hours and morale on appointments that were never going to close.
- 5
Cold Leads = Hostile Conversations.
The second a prospect clicks an ad, Meta serves them your competitors for the next 24 hours. By the time you reach them, they're already shopping you. The conversation turns adversarial.
Four Steps From Ad Click To Signed Deal.
We own the entire pipeline. No handoffs. No finger-pointing. No "lead-gen versus closing" line in the sand. Your team does one thing: show up and close.
Branded Meta Ads
We run Facebook and Instagram ads to your ideal customers. Branded with your name, your work, your reputation — not a generic landing page.
All-American Reps Work The Leads
Our in-house ISA team is based in the U.S. and trained on your offer. They call and text every lead within minutes. No offshore call centers. No accent issues.
Qualified And Booked
Every appointment is scrubbed against your criteria — budget, location, decision-maker, intent. Only matches make it onto your calendar. Period.
Pre-Show And 24-Hour Confirm
A multi-touch warmup keeps the prospect bought into your brand before you meet. We then double-confirm within 24 hours of show time. No empty slots.
Built For Operators Who Are Tired Of Being A Number.
We're not a software company. We're not a media buyer. We're an operating partner for high-ticket service businesses that want predictable, premium-priced demand.
100% Exclusive Appointments
Every appointment is yours and yours only. Never shared. Never resold "to test the market." If we book it for you, no competitor sees it.
All-American ISA Team
Every call your prospect takes is from an all-American rep trained on your offer. No offshore script-readers. No "Hello, am I speaking to…" in a heavy accent.
Branded, Not Generic
Ads run in your brand. Your logo. Your colors. Your work. Your reviews. Prospects see Crestline's system but recognize your company.
Custom Qualification Criteria
We sit down with you and define exactly what a "good job" looks like for your business. Then we filter to that spec, ruthlessly.
Pre-Show Warmup Sequence
From the moment they book, we keep your brand top-of-mind — so when your team shows up, the conversation starts warm, not adversarial.
24-Hour Double Confirmation
Within 24 hours of every appointment, our team reaches out to confirm. Twice. If they're a no, we know — and your team doesn't waste a minute.
Simple, Transparent Engagement.
No long-winded "it depends." Here's exactly how a done-for-you engagement with Crestline is structured.
Our flat management fee for running the entire system — ads, all-American ISA team, qualification, booking, pre-show warmup and confirmation. Set based on market, volume, and qualification complexity.
- ✓Branded Meta ad creative & media buying
- ✓U.S.-based ISA team working every lead
- ✓Custom qualification against your exact criteria
- ✓Booking, pre-show warmup & 24-hour confirmation
A minimum of $100/day in ad spend on top of the service fee — paid directly to Meta, never marked up. Scale it as high as you want, depending on how quickly and how far you want to grow.
- ✓$100/day floor to keep the system fed
- ✓Scale up anytime — the ceiling is yours
- ✓Paid straight to Meta, fully transparent
- ✓More spend = more booked appointments
The math is simple: a flat $3K–$5K/mo to run the machine, plus the fuel (min. $100/day in ad spend) to power it. Want to scale faster? Turn the spend up. We'll tell you straight on the call what your market can absorb.
Straight Answers. No Fluff.
The questions service-business owners actually ask us on the first call. If yours isn't here, we'll answer it on the call.
Book Your Call- Lead-gen sells you names. We sell you outcomes. A "lead" is someone who filled out a form — they may or may not pick up the phone, have budget, or be the decision-maker. An appointment is a prospect who got called by an all-American rep, qualified against your exact criteria, booked into your calendar, and double-confirmed before show time. The work between "lead" and "appointment" is where most agencies hand it off to you. We do all of it.
- Yes — that's the whole point of the proof wall above. The same system has produced results across 39+ niches: home services, law firms, med spas, dental, financial, coaching, clinics and more. The mechanism (branded demand → U.S. reps → qualification → booked, confirmed appointments) is industry-agnostic. We simply tune the creative and qualification spec to your vertical.
- 100%. Every ad we run is in your brand. Every lead generated belongs to you and only you. We don't run a "lead marketplace" or resell to competitors in your area. If we book it for you, no one else sees it.
- A done-for-you engagement is a flat service fee of $3,000–$5,000/month — set by your market, volume, and qualification complexity — plus a minimum of $100/day in ad spend paid directly to Meta (never marked up). You can scale the ad spend as high as you want depending on how fast you want to grow. Full breakdown in the Engagement section above.
- Show rates are never 100% in any business. Our system pushes them as high as possible: the pre-show warmup keeps the prospect bought into your brand, and the 24-hour double-confirm catches no-shows before your team commits time. We'll walk through specifics on your call.
- From signed agreement to first appointments on your calendar is usually 7 to 14 days. The timeline depends on how fast we can finalize creative, your targeting, and the qualification criteria. We move fast — never at the expense of getting your spec dialed in.
- Established service businesses with the operational capacity to handle 20 to 50+ additional qualified appointments per month, and a real offer with healthy margins. We're not the right fit for brand-new operators who aren't ready to close volume.
Stop Buying Leads. Start Closing Appointments.
Book a 30-minute scaling call. We'll look at your market, your numbers, and your qualification spec — then tell you straight whether we can move the needle for you. If we can't, we'll tell you that too.
Book Your No-Pressure Scaling CallFree 30-minute call. No pitch. No fluff. No high-pressure close.